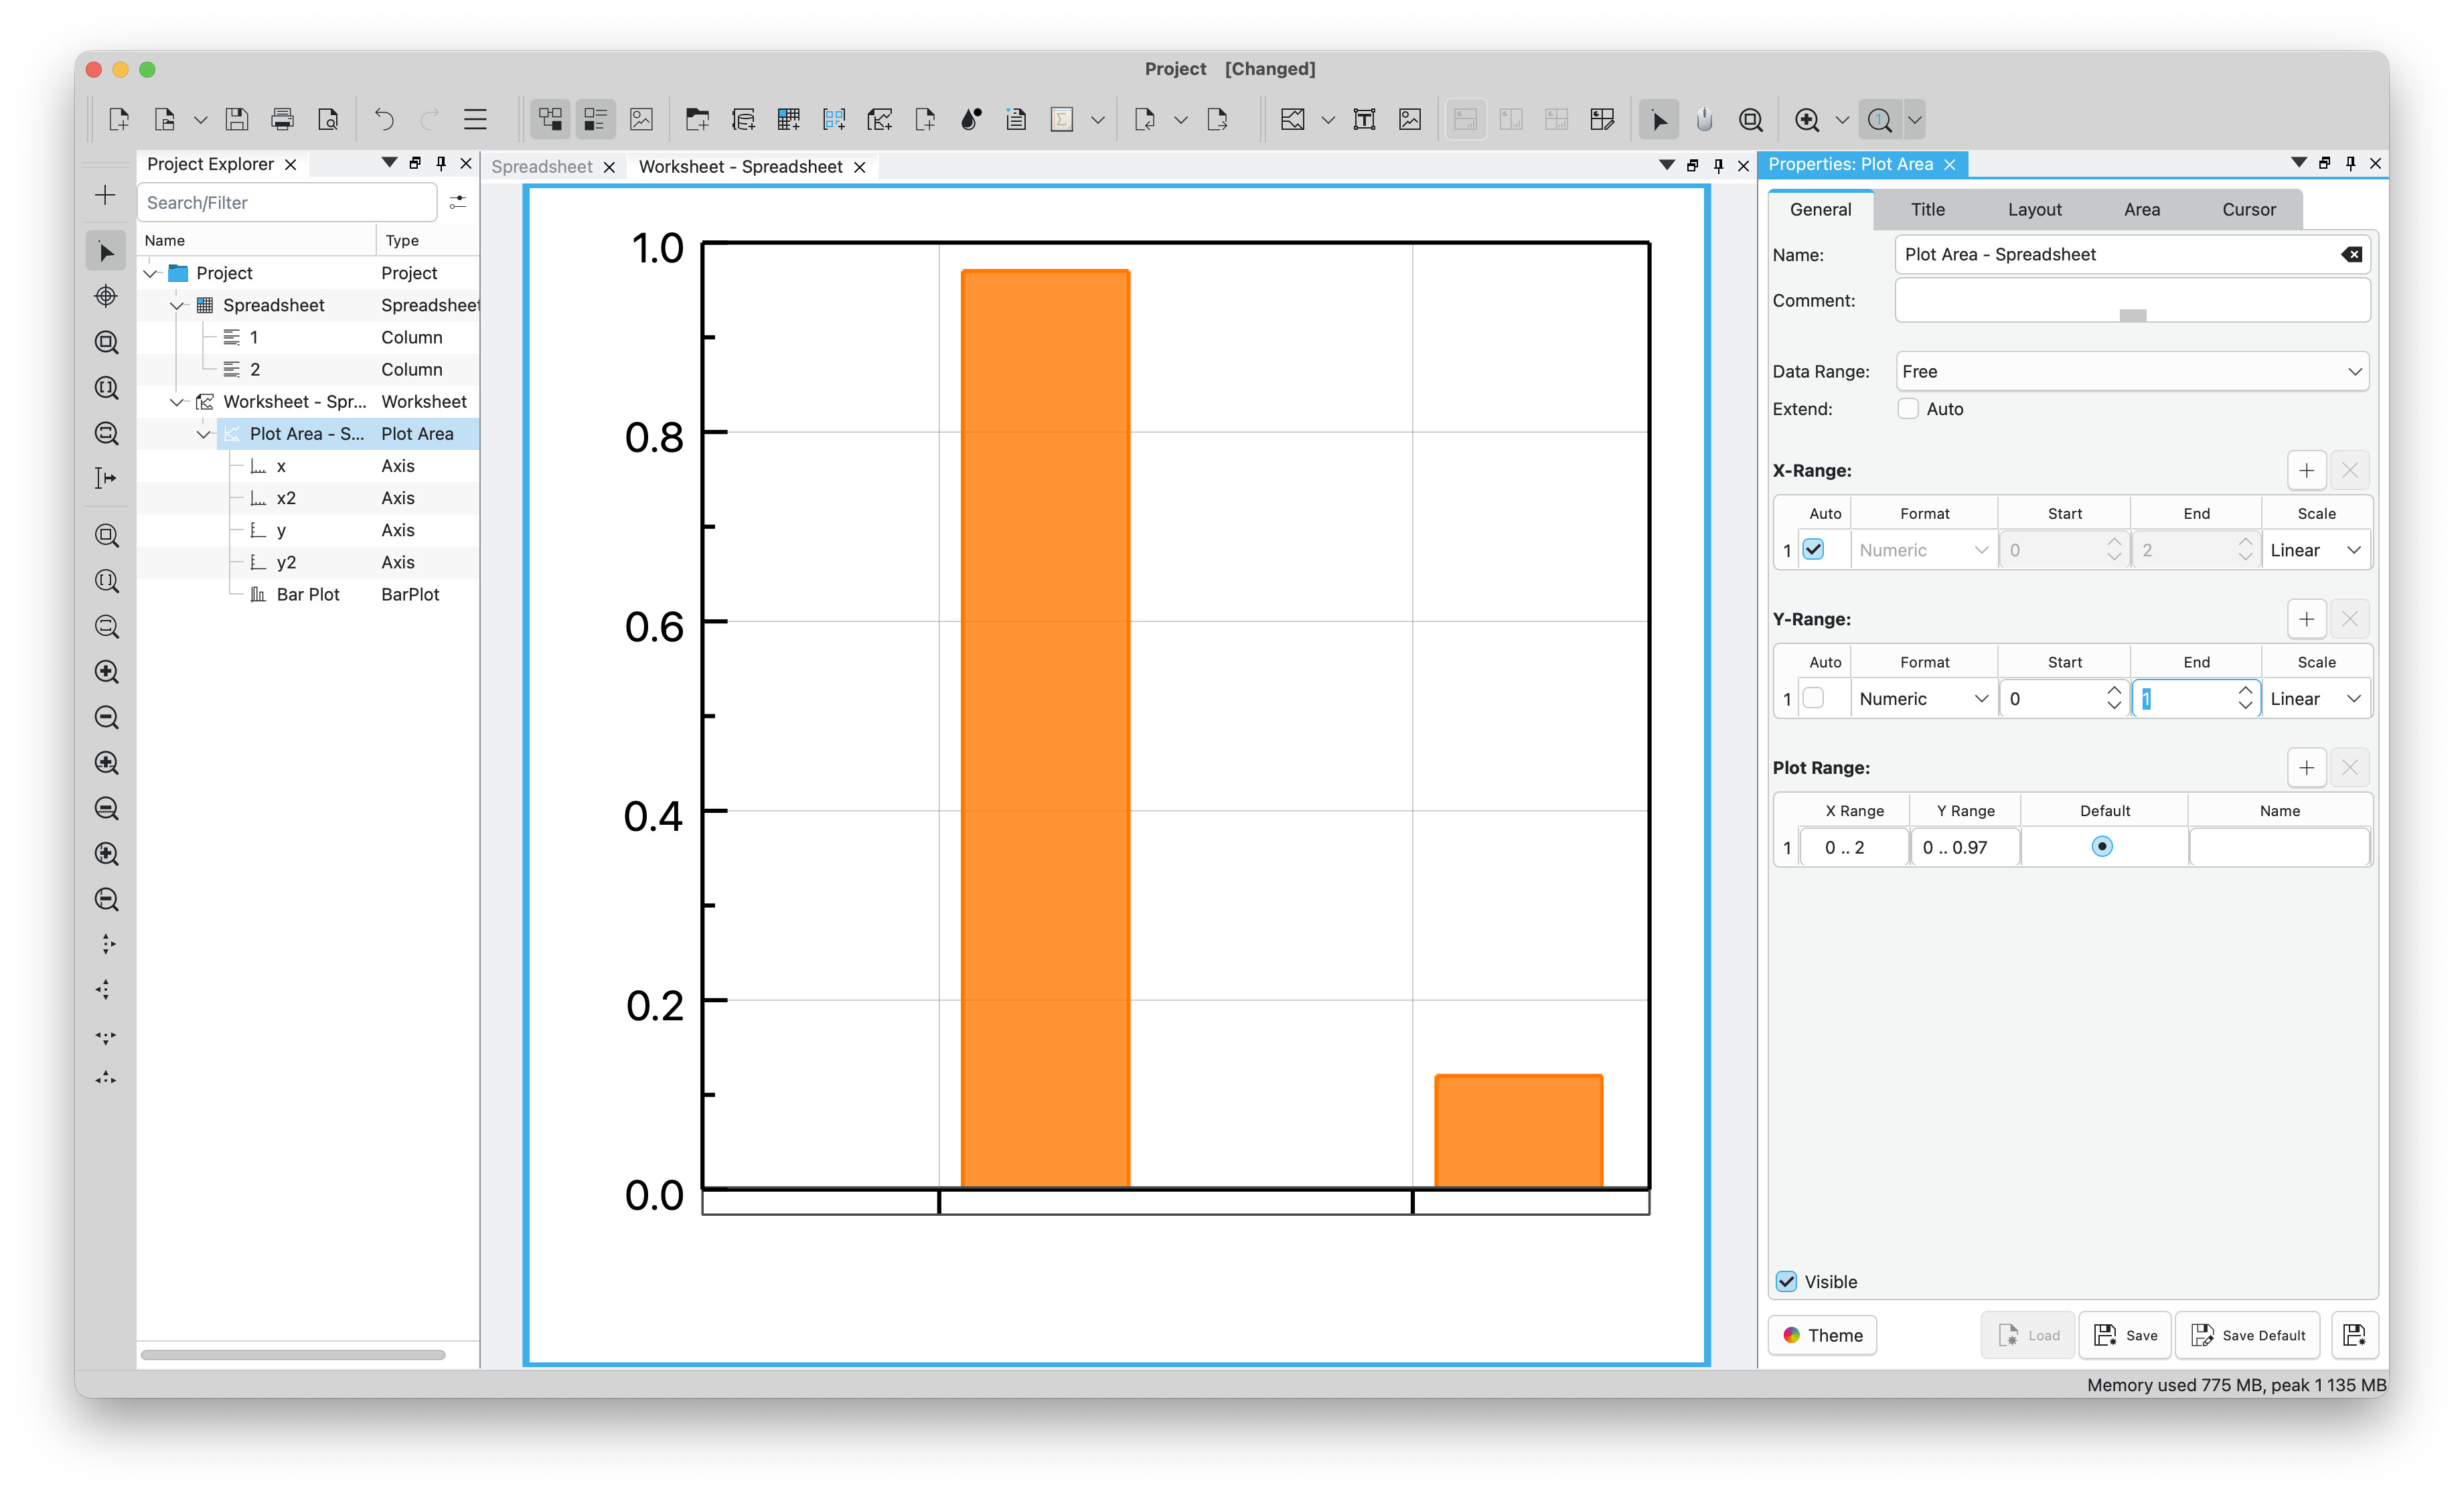
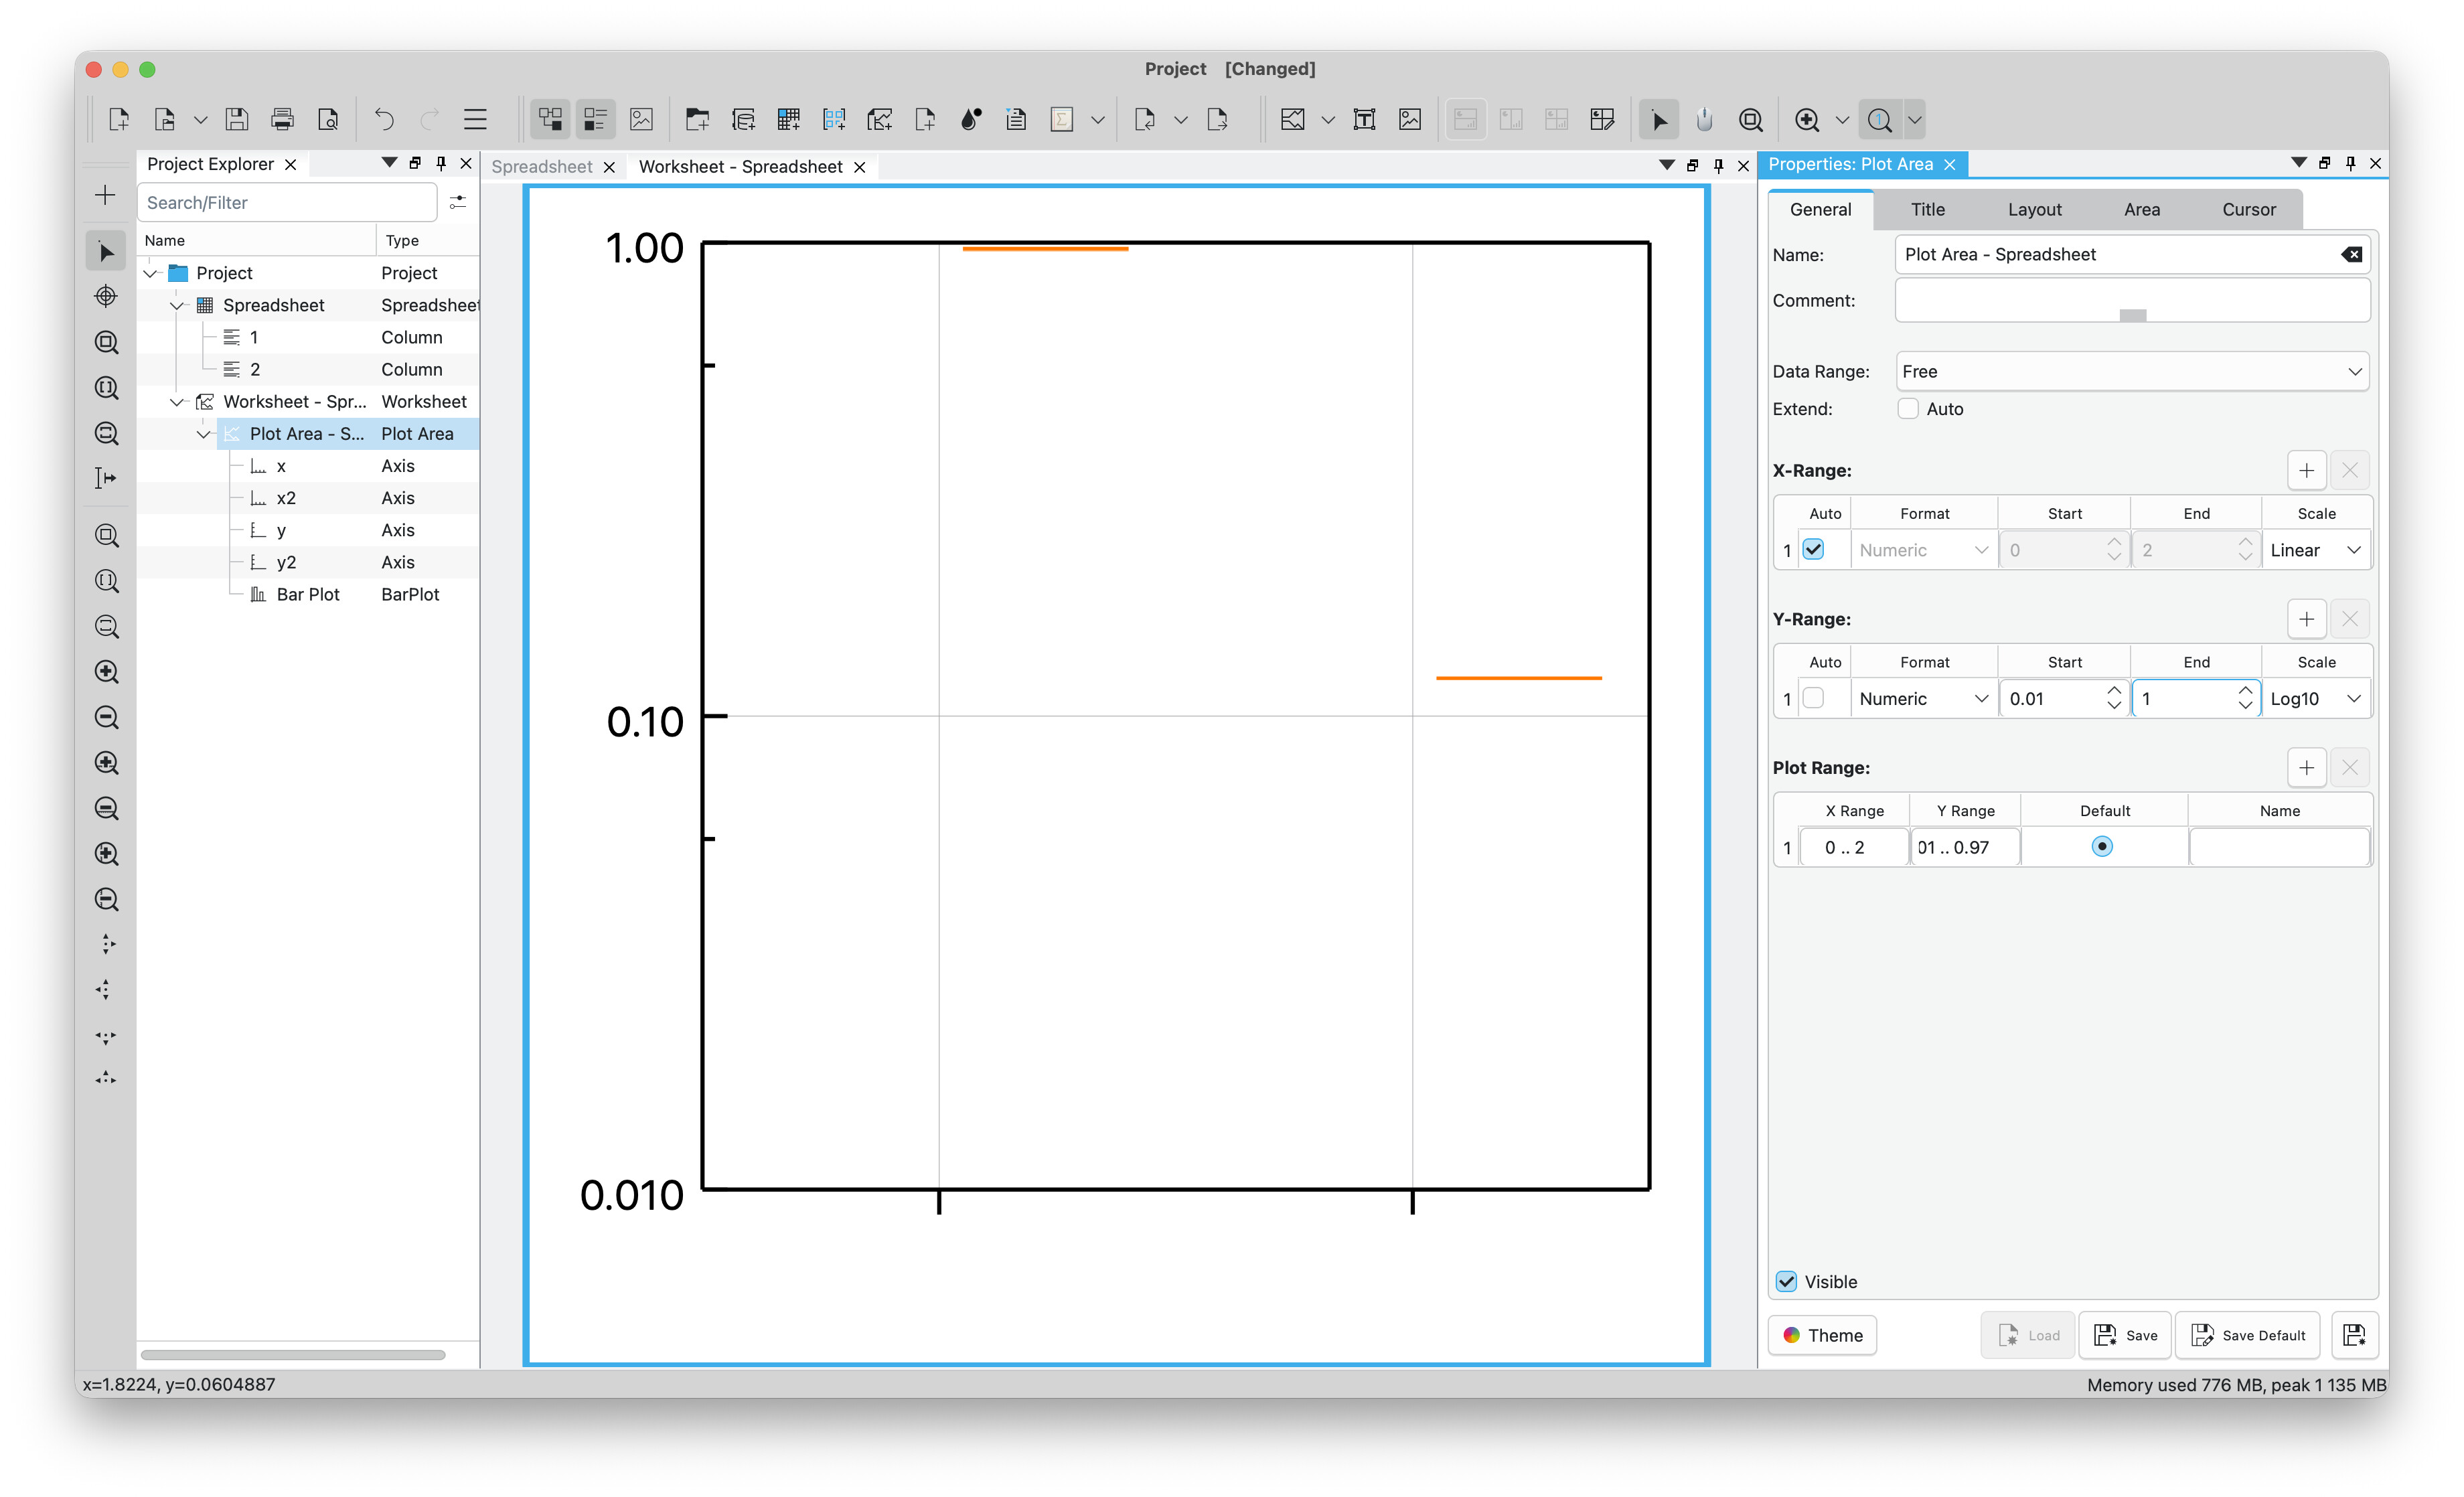
I want to have the y-axis in my bar plots in Log10. But if I select Log10 the following happens. Anyone knows what the problem is and how to solve it? Just as an example:
What program is that and who made it?
It’s a bug. We’ll check it. Thanks for reporting this problem.
It’s LabPlot. For more info please check labplot.org.
We did a fix for this problem today. If you have a chance to give our current development version a try, please check the builds mentioned on our homepage (windows build and AppImage for linux were updated today). There is also a short tutorial on this topic on Log-Scale Bar Plots — Labplot Manual 2.12 documentation
Hi. Just gave it a try on a windows machine. Works like a charm. Thank you!
thank you for the confirmation and thank you for letting us know about this problem in LabPlot!