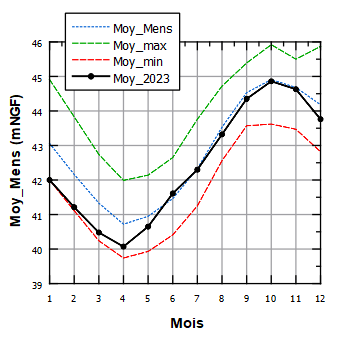
Hi, im not very good with labplot but im using it for doing graph. i need to do a graph like the one in upload files but starting from october to september. I cant find how to do it.
Thanks for your help
how does your original data look like? can you share it here?