Poking around in top further, I found this page showing 2 CPUs with high ‘wa’ (Wait on IO). Presumably, that is due to the CPUs being much faster than the USB transfer.
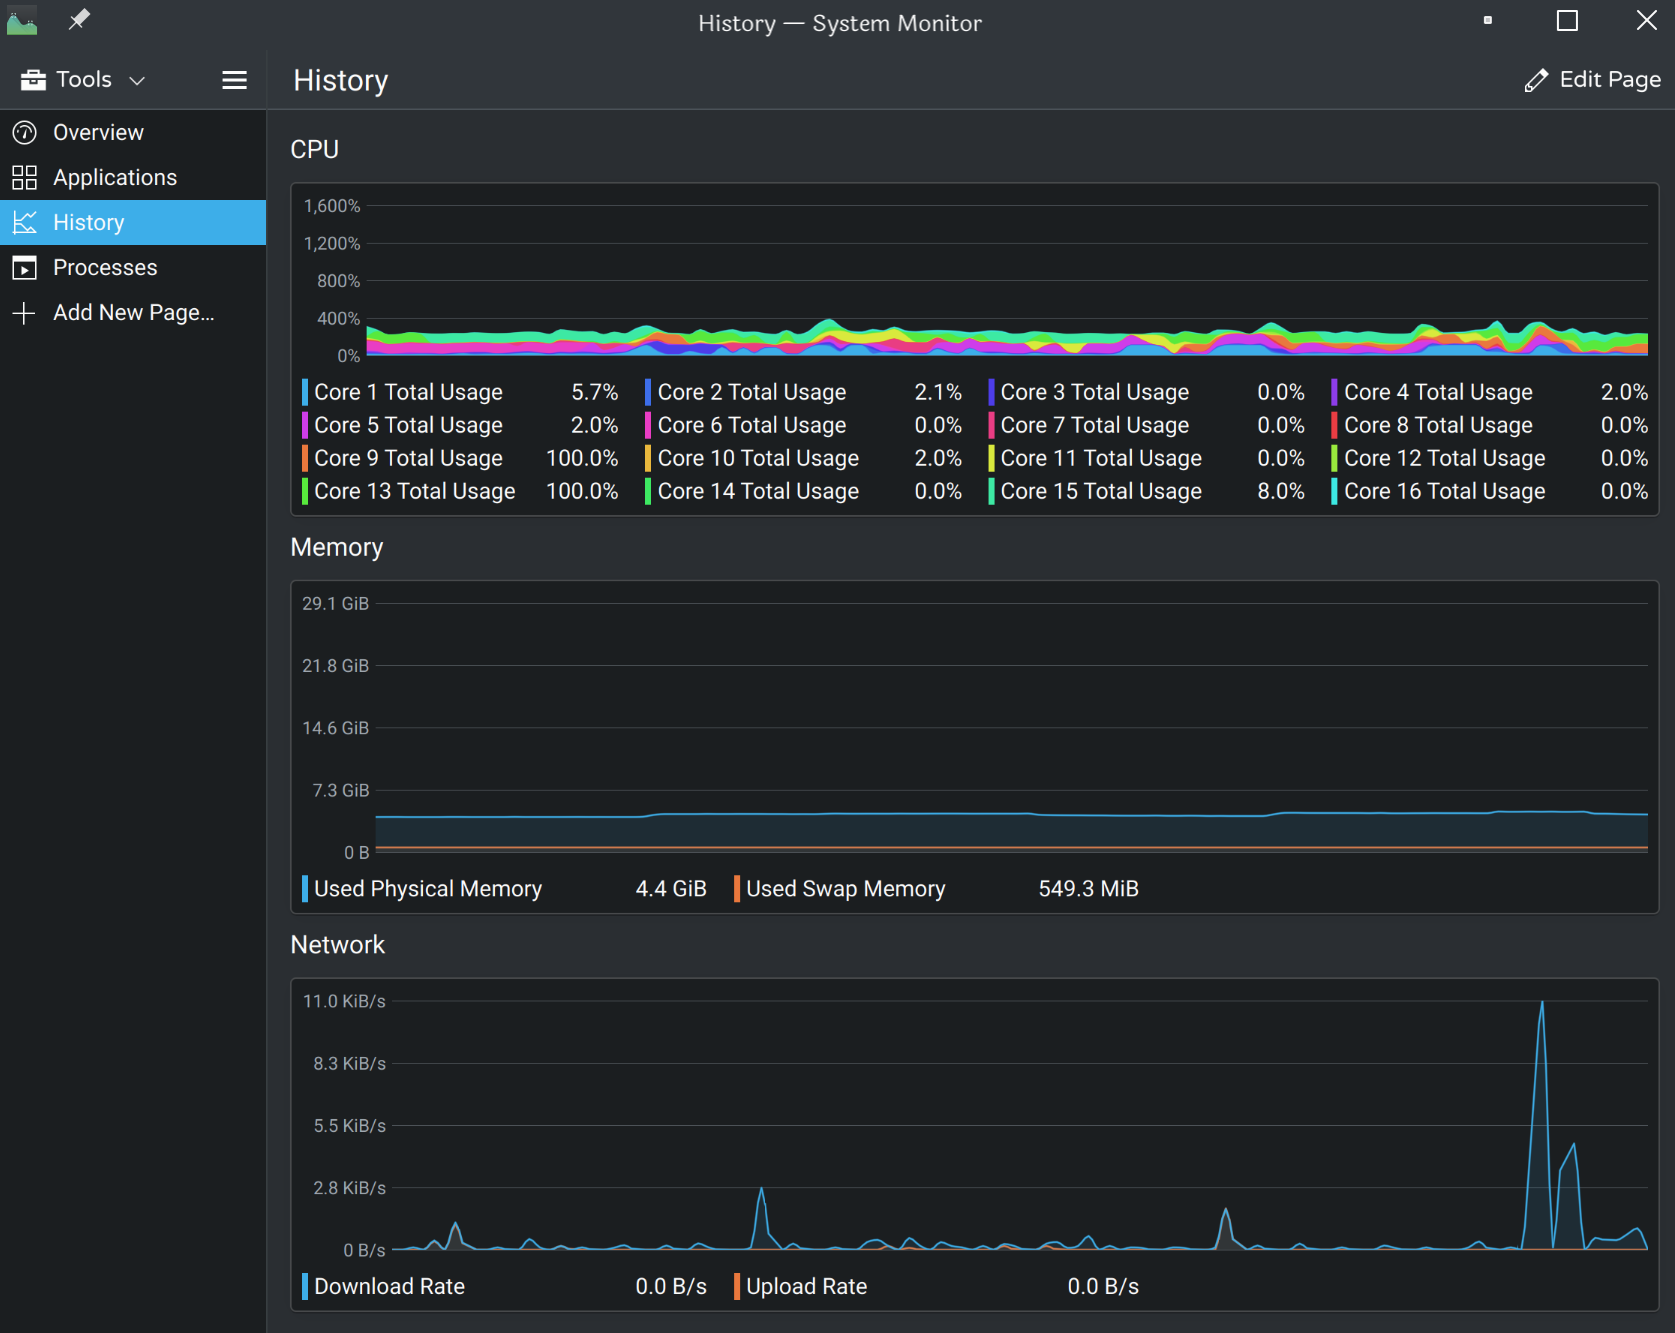
It seems System Monitor is counting IO-Wait as actual CPU usage when looking at cores, but is not counting that when looking at applications (dolphin would be at 200% since it is the app waiting on IO). This seems to differ from other monitoring tools.
You just fail to understand what is happening. It is taking 100% of two of your cores, two threads to do the copying. With that taking 18% of the total. Multiply the 18% x 4 for a 8 core 16 thread processors you appear to have and you get close to 80%. So it is getting close to the usage seen allowing for other things the system is doing too. It is just the way the system works with the thread allocation for the task involved. When I encode video since it is fully multi-threaded using all core/threads. I see basically all the load spread across all my 6 cores as there is no hyper-threading BS on my machine to double the count so there were 12 to be used by it…
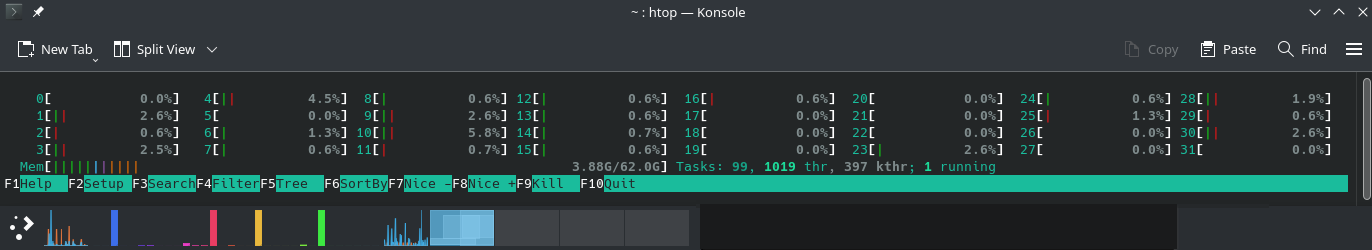
I agree that I fail to understand everything that is happening as I only just figured out how to get top to show that IO-Wait screen, but I’m not sure you understand my question or what I was showing via the pics. I probably did not explain this well enough so I’ll try to expand on it. Top does not show the same CPU usage on a per core basis as System Monitor. You can see this in the 2nd to last pic with Cpu5 at 10.3% in top but 100% in System Monitor. That’s not overall CPU, that is specifically looking at individual cores in both.
The only explanation I am able to deduce is shown in the last pic where I see IO-Wait maxing out on two cores in top. So my guess is System Monitor is counting IO-Wait as CPU usage where top is not.
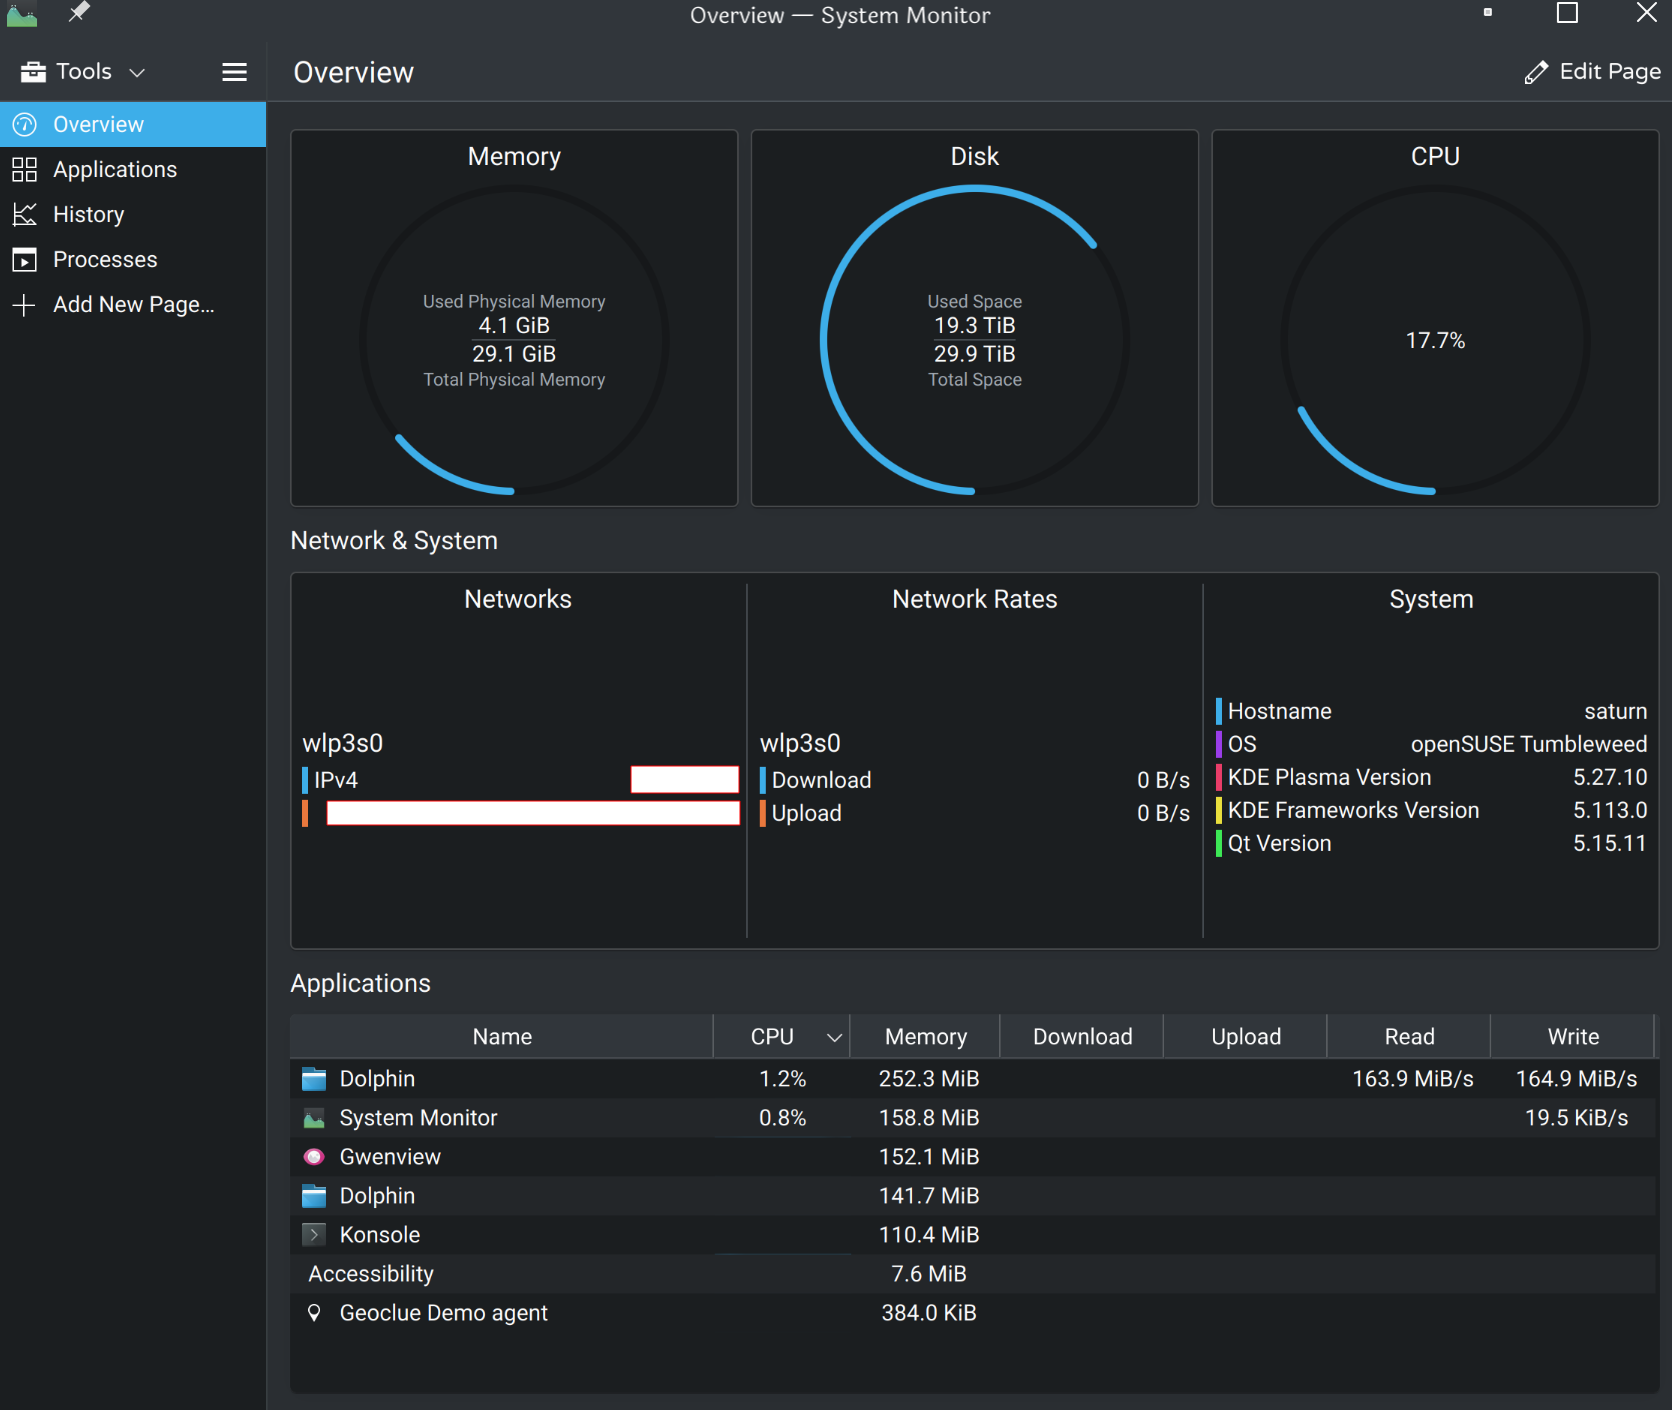
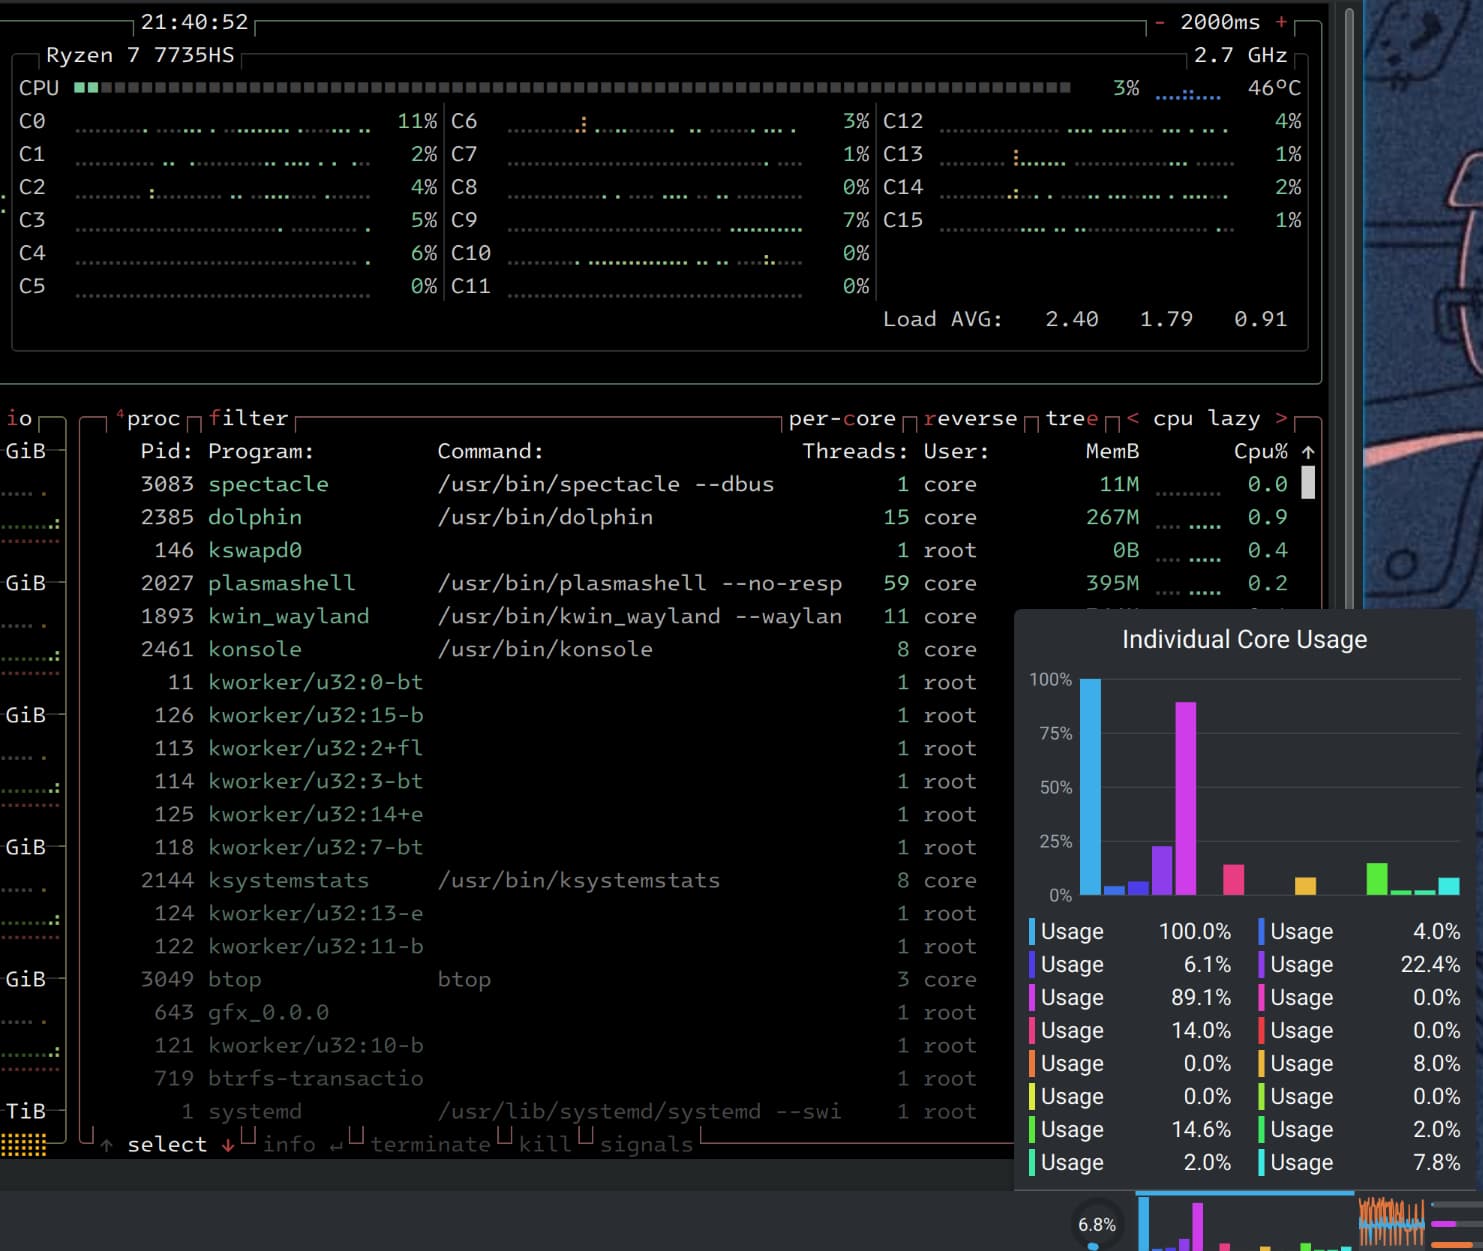
The reason I found this confusing is that I was trying to find what was consuming all the CPU resources, but neither top nor System Monitor seem to include IO-Wait when showing app usage. In the 2nd pic, dolphin is only consuming 1.2% CPU but up at the top right in the circle monitor it shows 17.7% CPU used and nothing was squaring that circle. I spent a long time trying to track this down including installing another app, btop, which shows the same thing in this pic with the CPU not maxed out in btop even though System Monitor shows it.
Have you ever had the thought that one shows the core usage which is 100% and the second shows a percentage of the total system usage? Which would be 12.5% on an eight core system, with the 10 shown there coming real close to it. As long as it works to expectations the imprecise reporting statics mean nothing.
I am seeing the same thing and was very confused. It’s not only about the percentages since htop also use per core bars that go from 0-100% which would not make sense if it was percentage of the combined cpu.
If I run something like sysbench that pegs a cpu core at 100% I see both htop and the widget at 100%, but with other workloads I frequently see the widget showing a core at 100% while htop shows it at just a few %, so they seem to not measure the same thing?