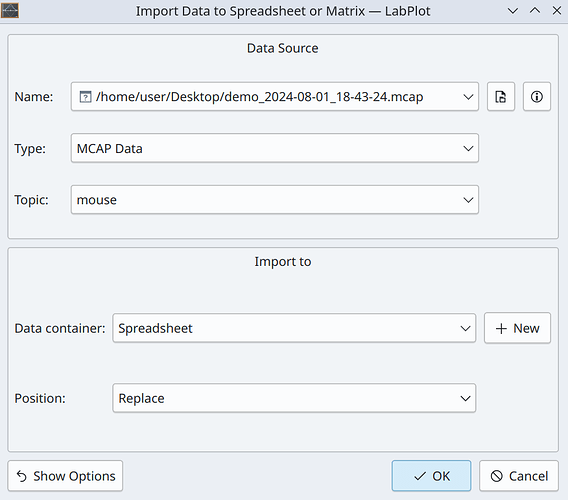
Add MCAP support
MCAP is a modular container file format, useful for pub/sub and robotics applications.
Added a new dialog for searching, downloading and importing datasets from kaggle.com.
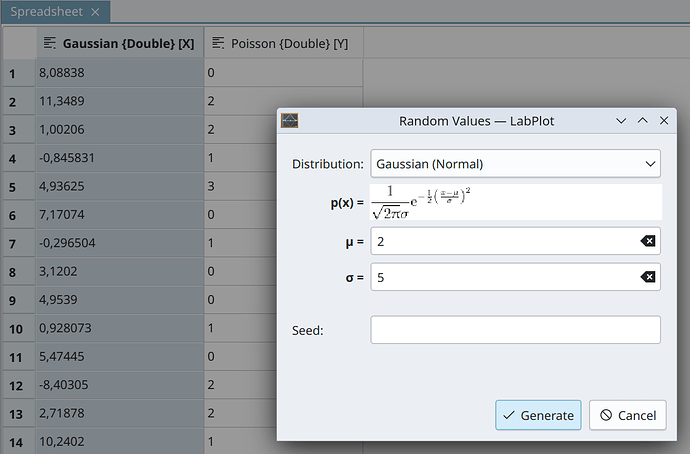
Add new functions to the functions editor for the periodic and random sampling
- y = psample(x, period = 3) - periodic sampling
- y = rsample(x) - random sampling
Fill up the colum “y” with the values sampled for the x column.
Functions of Curves
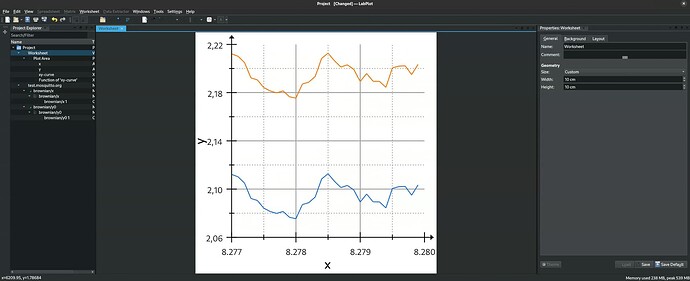
Add possibility to apply functions on curves directly on the plot so it is possible to calculate for example the difference between curves, to scale or shift curves, etc.
Example (shifted and scaled curve)
Allow to provide names for plot ranges
Allow to provide names for plot ranges for easier lookup and assignment in the plot elements.
Process Behavior Charts (Control Charts)
The merge requests implement the Process Behavior Charts (control charts or Shewhart charts). These are tools used in statistical process control. They help assess whether e.g. a manufacturing or business process is operating within a state of control (whether it’s predictable).
Info view mode in the Color Maps Browser
Info view mode in the Color Maps Browser that shows detailed information about the used colors in the color map and that also allows to copy those values.
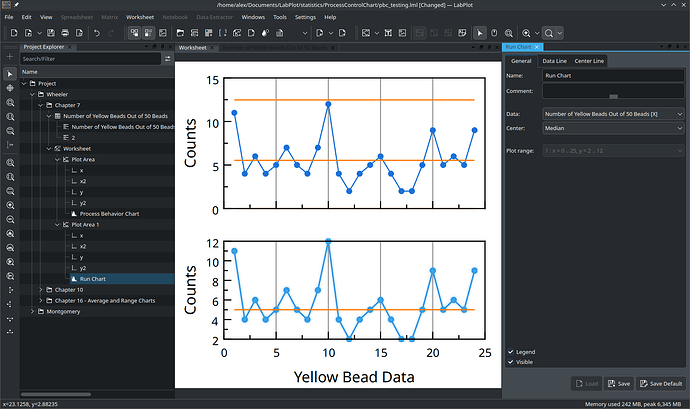
Implemented the new visualization type Run Chart
The screenshot below shows the comparison between the X (XMR) and run charts:
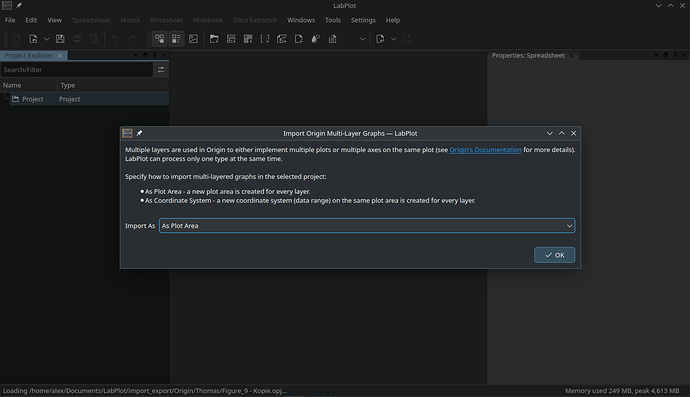
When opening an Origin file, ask the user how to treat the multi-layer graphs
When opening an Origin project file directly via “Open Project”, ask the user how to treat the multi-layer graphs.
RAND_MAX programming constants
Added the RAND_MAX programming constants for GSL (GNU Scientific Library) support.
Rewrite AsciiFilter
The asciifilter was rewritten from scratch to make it more readable and increase the parsing speed.
Use plot’s main color (line, symbol, etc.) for the text color in the legend
With this new option the legend text color can now follow the plot (line, symbol etc.) color or have a uniform color.
Parser: Improve performance
Improving parser speed by removing all symbols which are not required. The runtime of the benchmark test has decrease from 137 msec to 7.5 msec per iteration.
