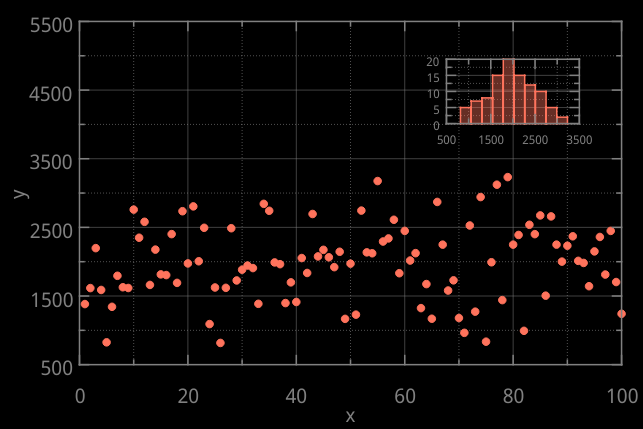
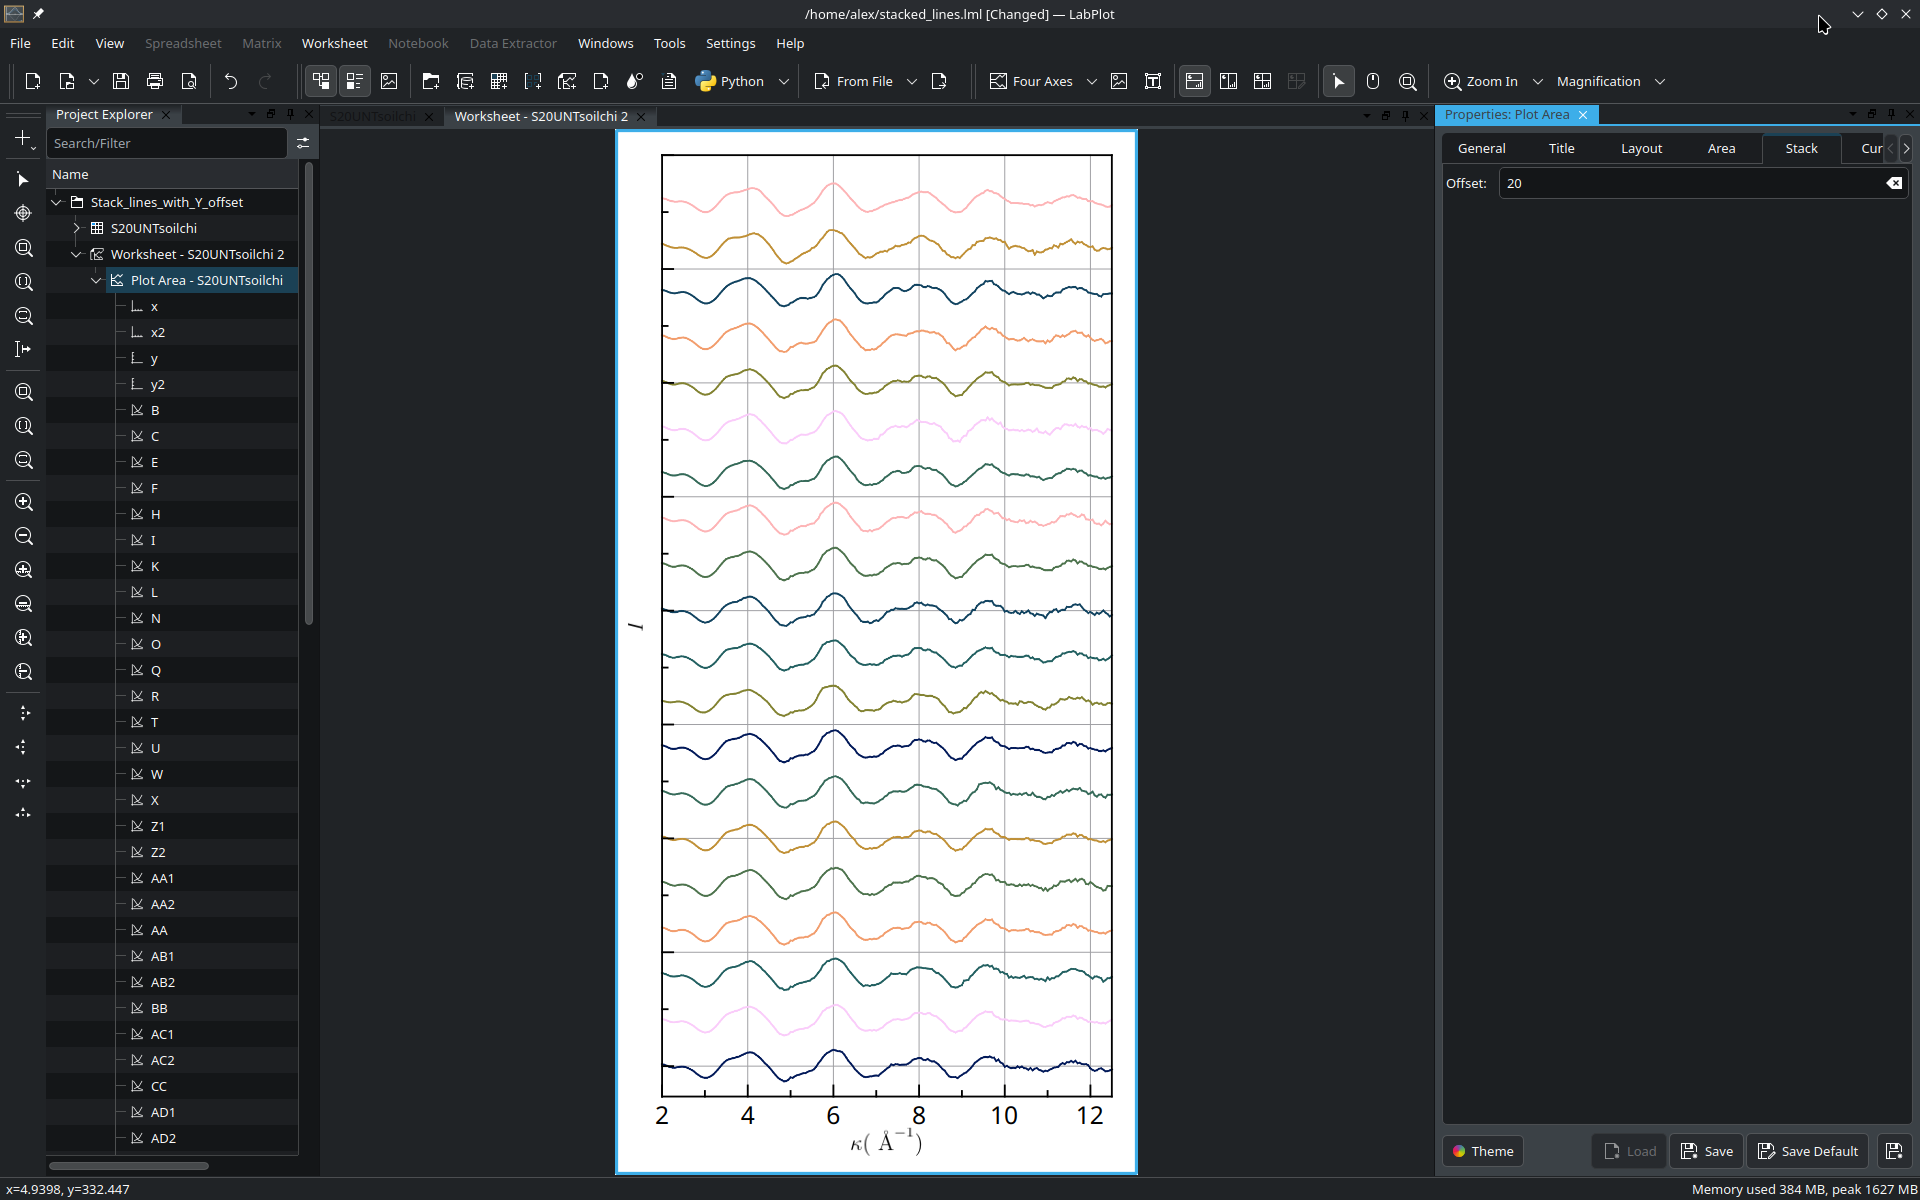
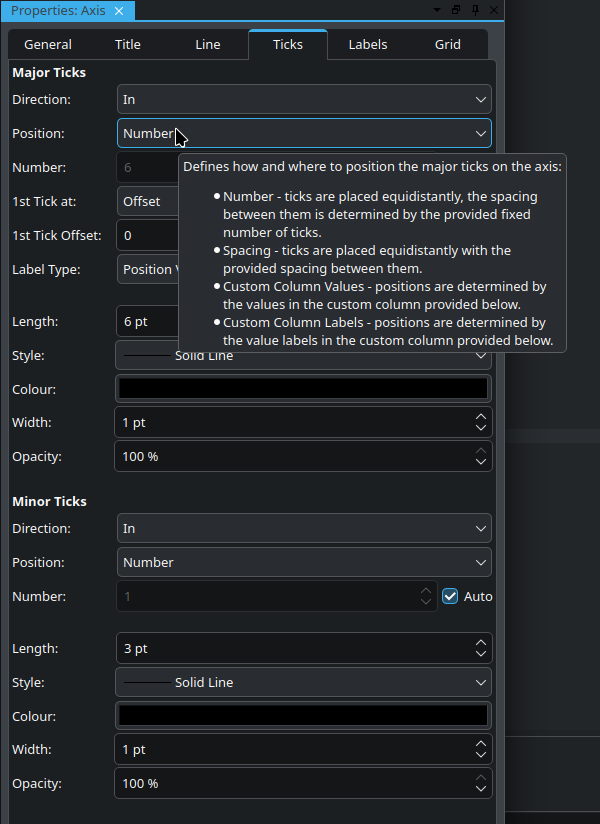
Create more appropriate ticks which are not forced to stick to the minimum and maximum. So the tick label values look much cleaner and the interactive mode looks more intuitive
A non-parametric test used to assess whether two independent samples come from the same distribution.
Useful when data does not meet the assumptions required for the t-test.
One-Way ANOVA
A parametric test comparing the means of three or more groups to determine if there is a statistically significant difference between them.
Widely used in experiments with multiple group comparisons.
Kruskal-Wallis Test
A non-parametric test for comparing more than two groups to determine whether they come from the same distribution.
Serves as an alternative to the One-Way ANOVA for non-normally distributed data.
Log-Rank Test
A statistical test used to compare the survival distributions of two groups.
Common in medical research and clinical trials for time-to-event analysis.
Independent Student t-Test(New)
A parametric test comparing the means of two independent groups to determine if they are significantly different.
One-Sample Student t-Test(New)
A parametric test used to compare the mean of a single sample to a known value or population mean.
These functions empower researchers and analysts with tools for parametric, non-parametric, and survival analysis, making the toolkit robust across a wide range of statistical scenarios.
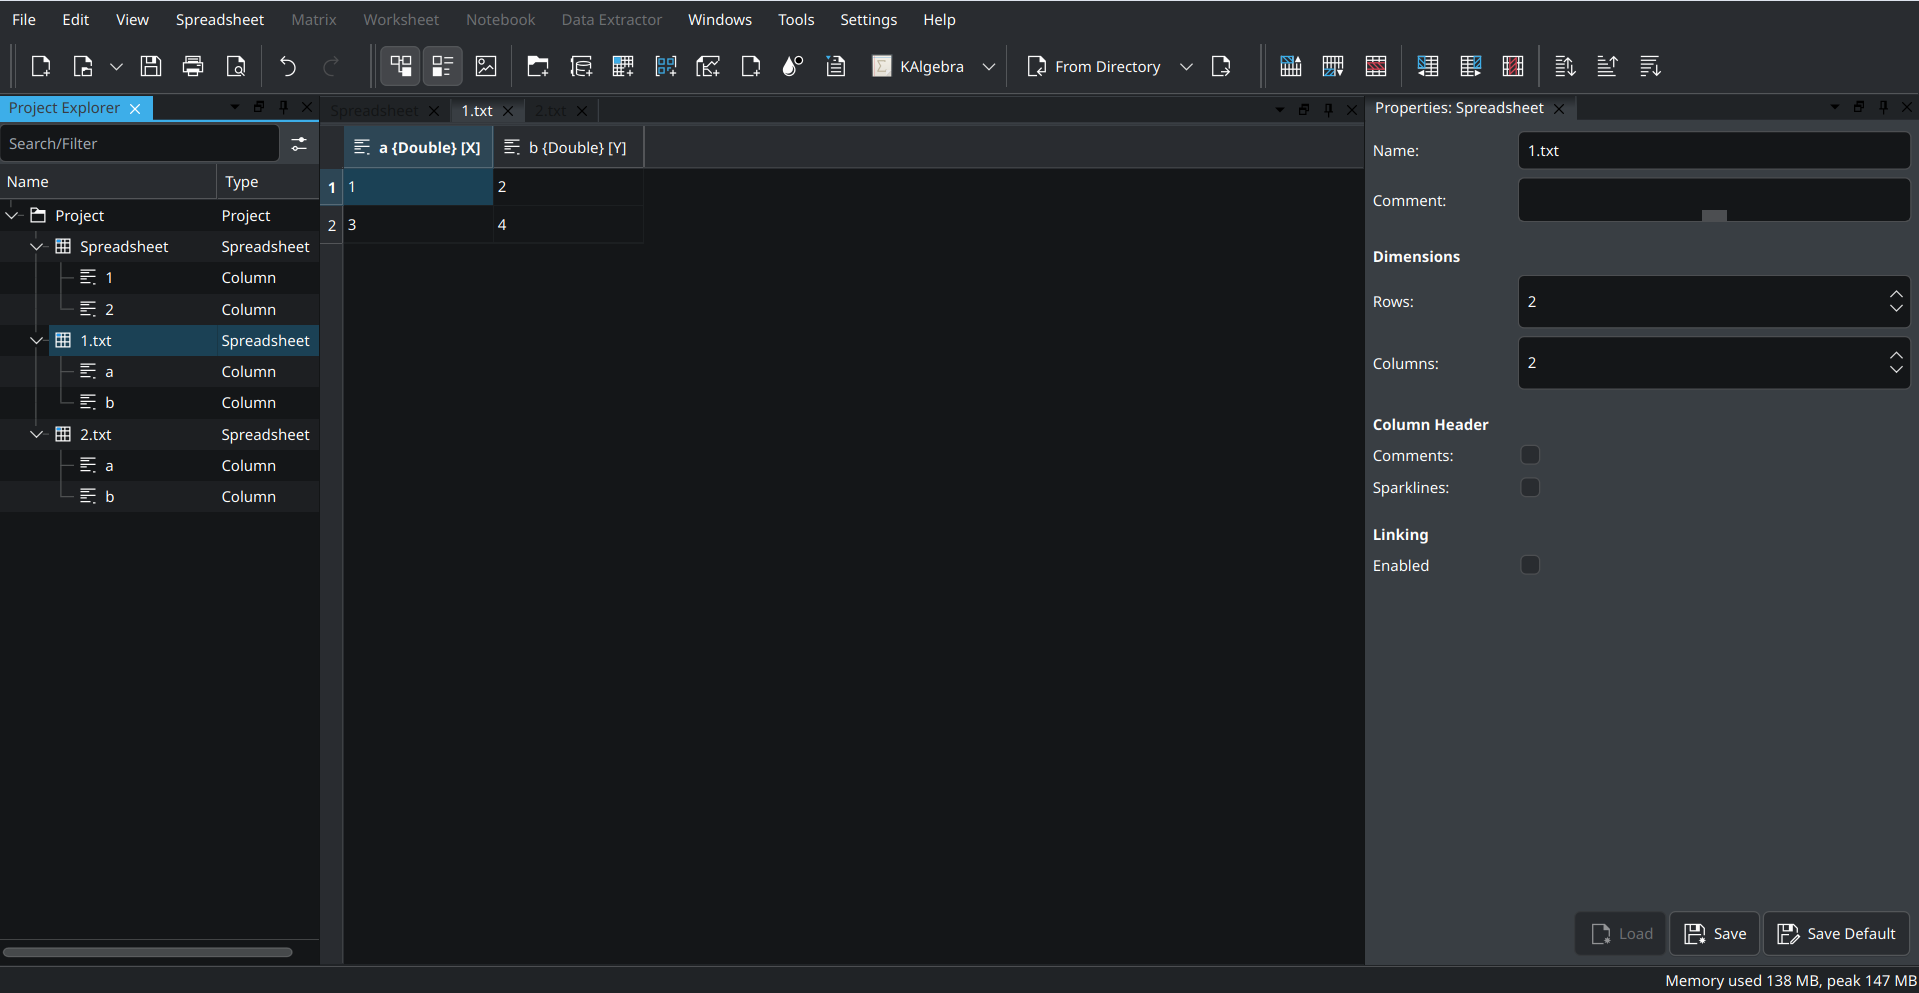
Significantly faster save and load of text columns
The performance gain is 2-3x for many text columns but can be also significantly bigger if the text structure is simpler and the base64 encoding is faster.
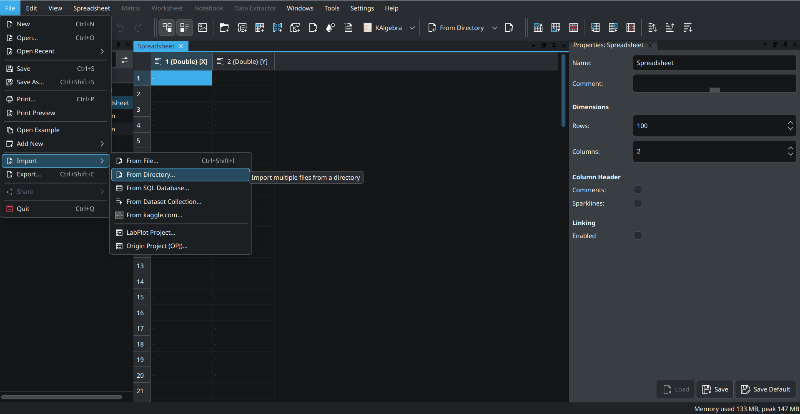
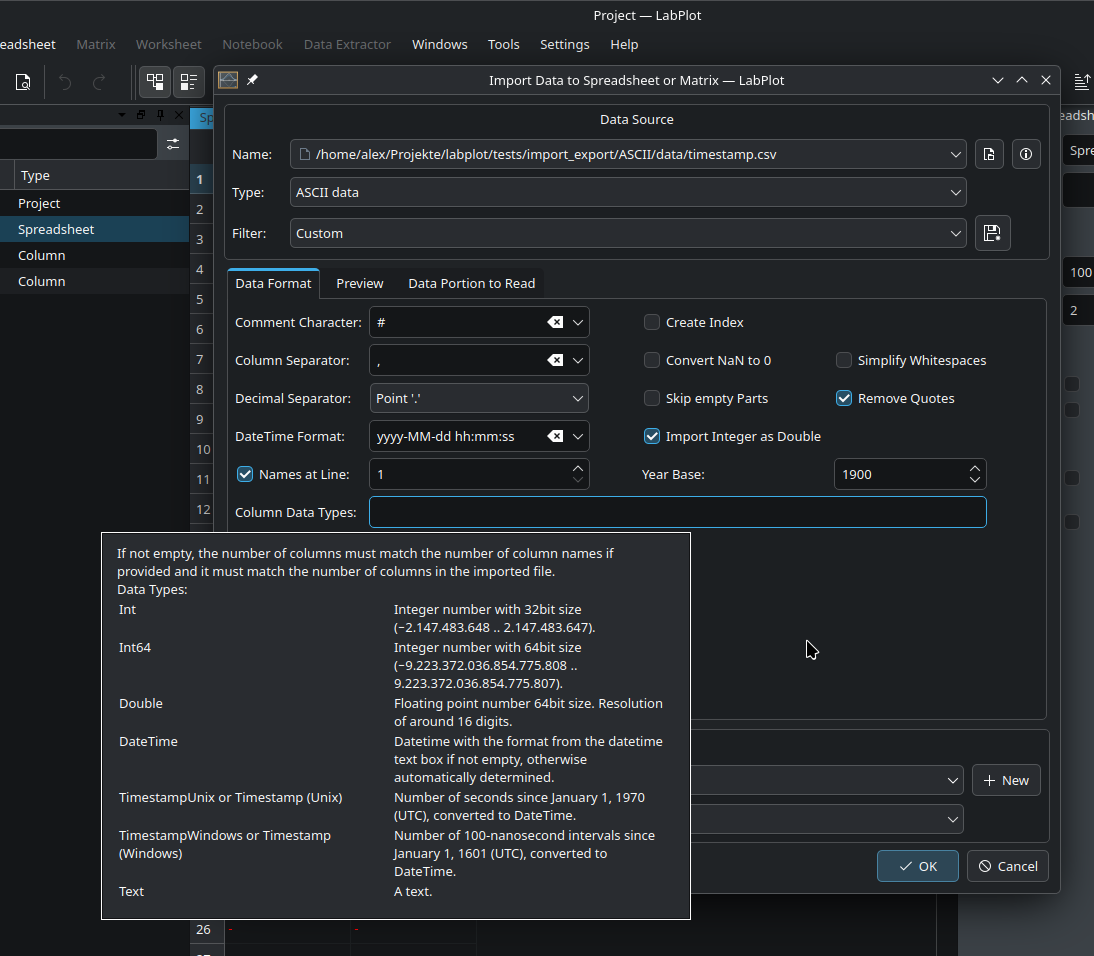
Import integer values in windows and unix timestamp formats
Support the import of Unix timestamps (number of seconds since January 1, 1970 (UTC)) and Windows timestamps (number of 100-nanosecond intervals since January 1, 1601 (UTC)).