Hi everybody, I’m not sure if I’m in the right place, but I have a question about creating stacked graphs in LabPlot. I can’t find this option in the app. I’ve found some guides online, but they seem to be for older versions.
Can someone help me? Maybe there’s some kind of workflow or algorithm for creating them. I need to make a type of line chart where multiple lines are stacked on top of each other to show the differences between them. So I have one x-axis and several y-axes.
Could you provide an example of the plot you are looking for? We are not sure which of the two types of plots presented in the links below you are interested in.
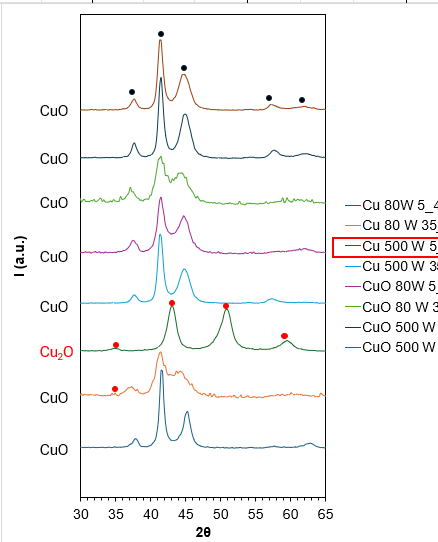
I need something like that. I know I can do it by manually adjusting the data and shifting each graph above the others, but is there another way to do it?
@ira We’ve recently added a new feature that lets you quickly stack plots on the y-axis. We mentioned this feature in one of our latest posts on Mastodon. You can test this new feature by using a nightly version, which is available here: Download – LabPlot > Development versions.