I want to be able to modify single data points on a scatter plot based on some metric i.e. if a material is cubic make the scatter plot mark square and so on…
However, I cannot seem to be able to do so as all of the markers get modified when I select one and modify the symbol on the properties tab.
@DrOxman,
You are right that changing the marker in the normal properties tab will always change all points in that series. To style single data points, you need to use the “Custom Point” feature, which also lets you override the default marker just for selected points.
How to style a single point
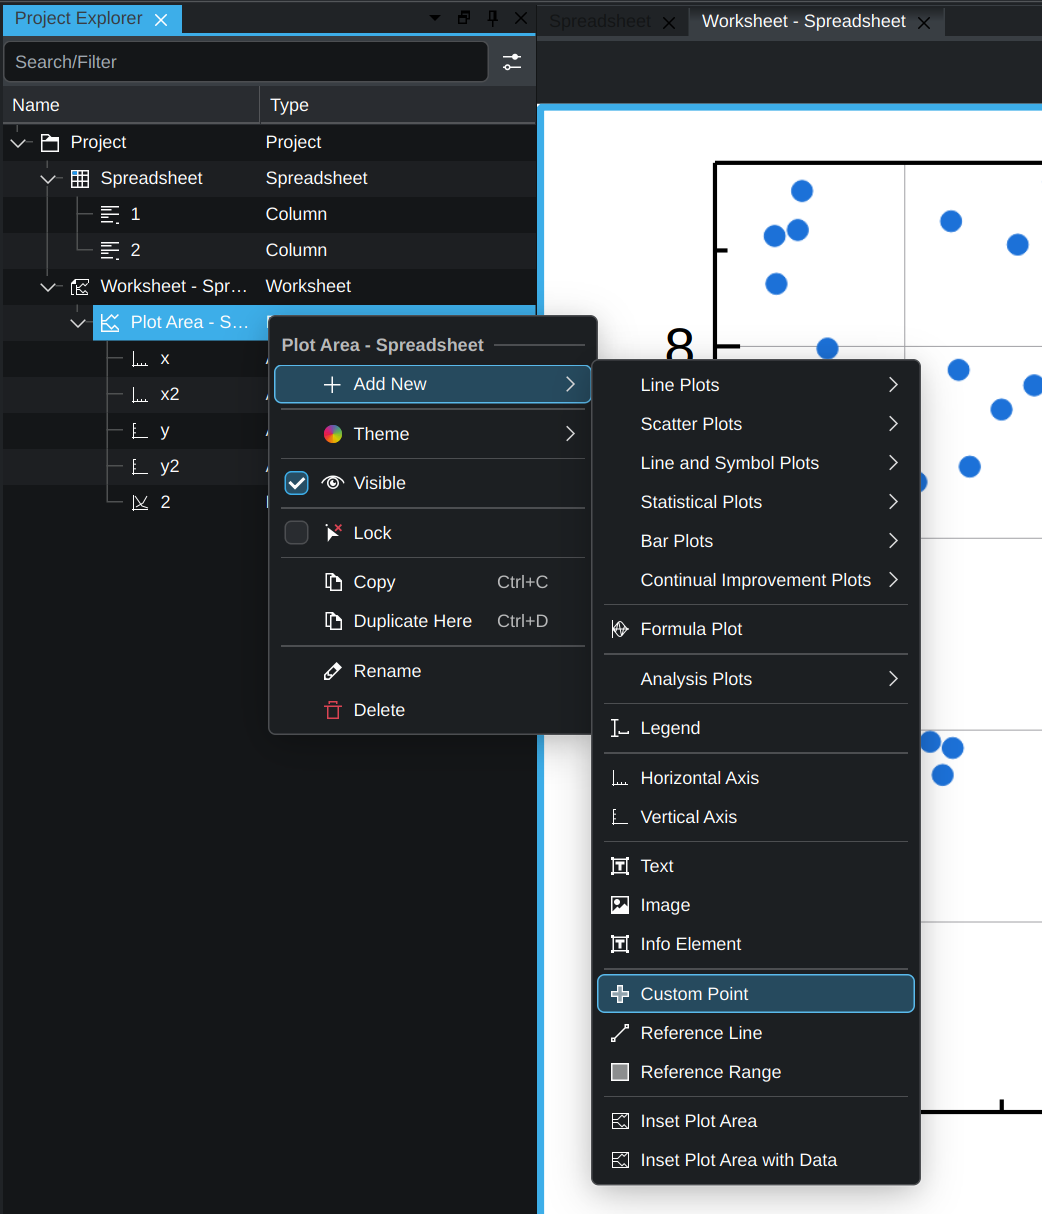
In the Project/Plot Area, right‑click the plot area and choose Add New → Custom Point (the option shown in the image).
In the properties of this new Custom Point, specify which data point(s) it should apply to.
Set the symbol/marker for that Custom Point to a square (or any other shape).
Using multiple Custom Points with different conditions, you can give different marker shapes to different categories within the same scatter plot.