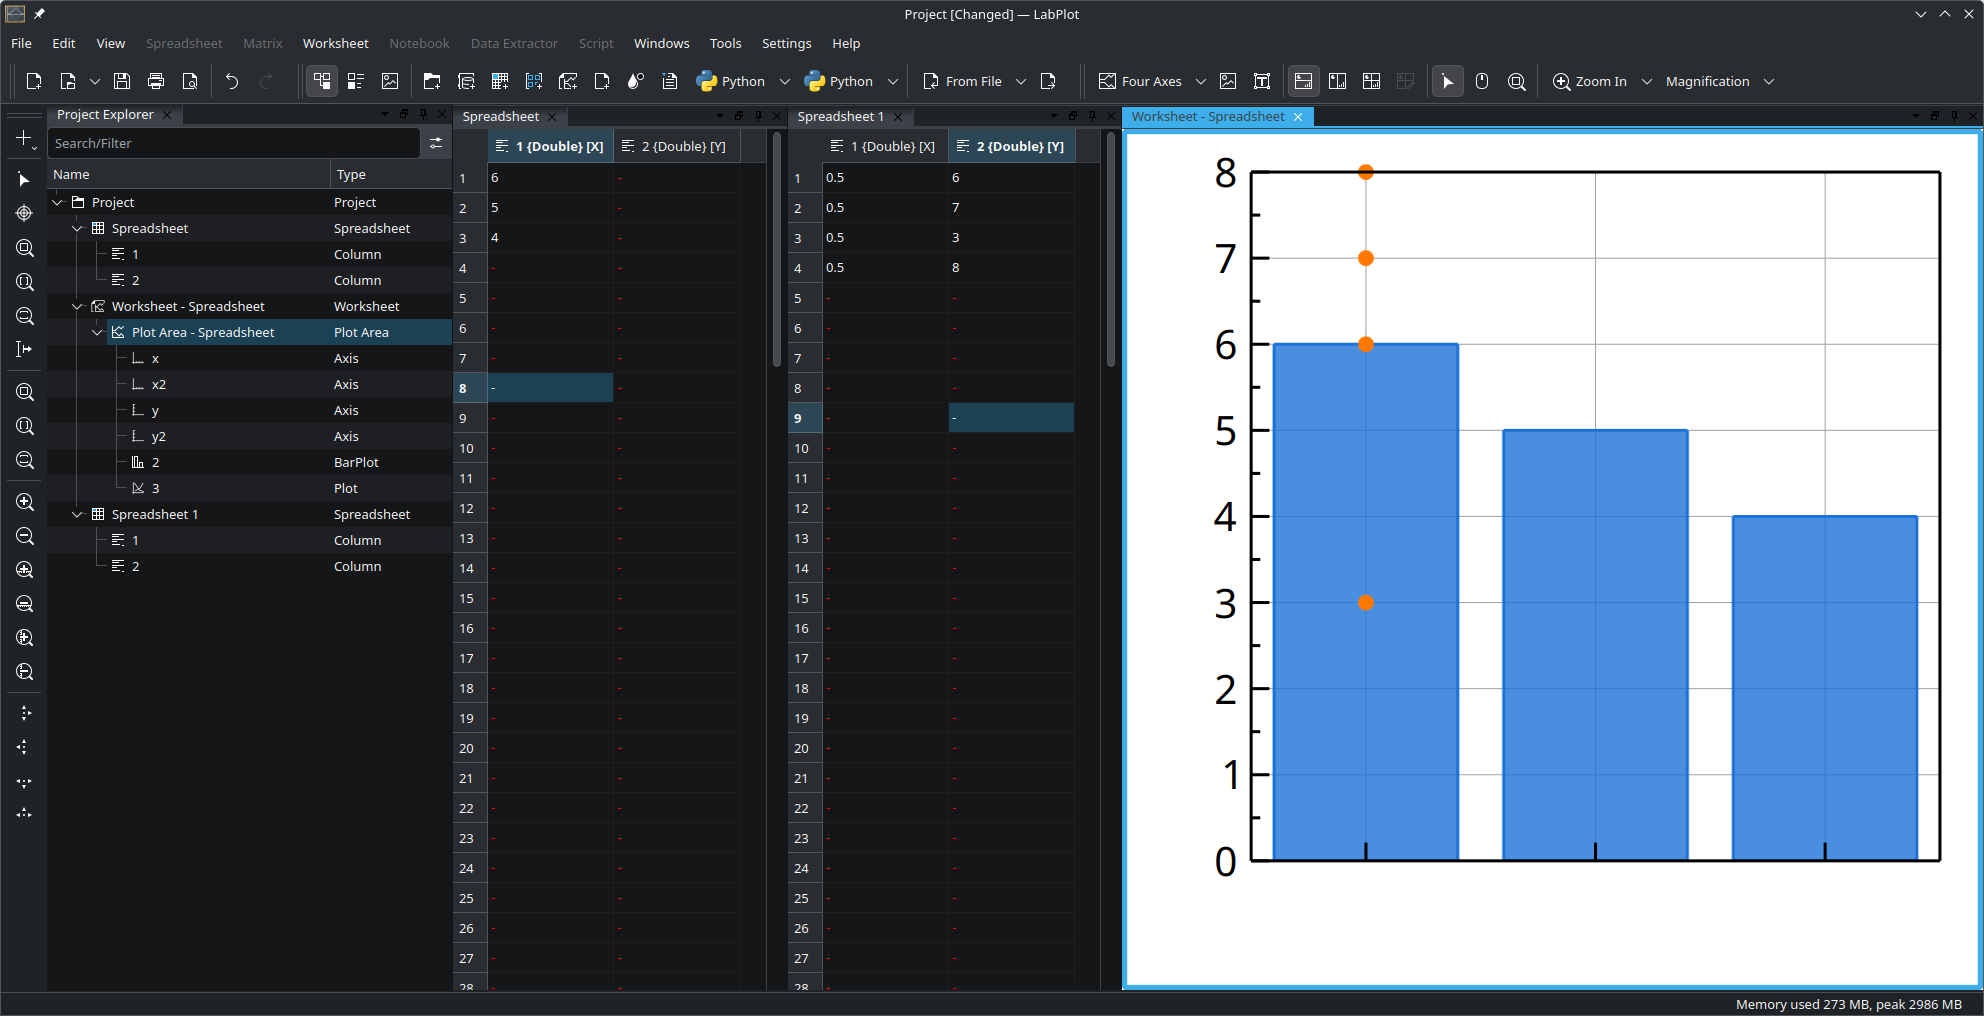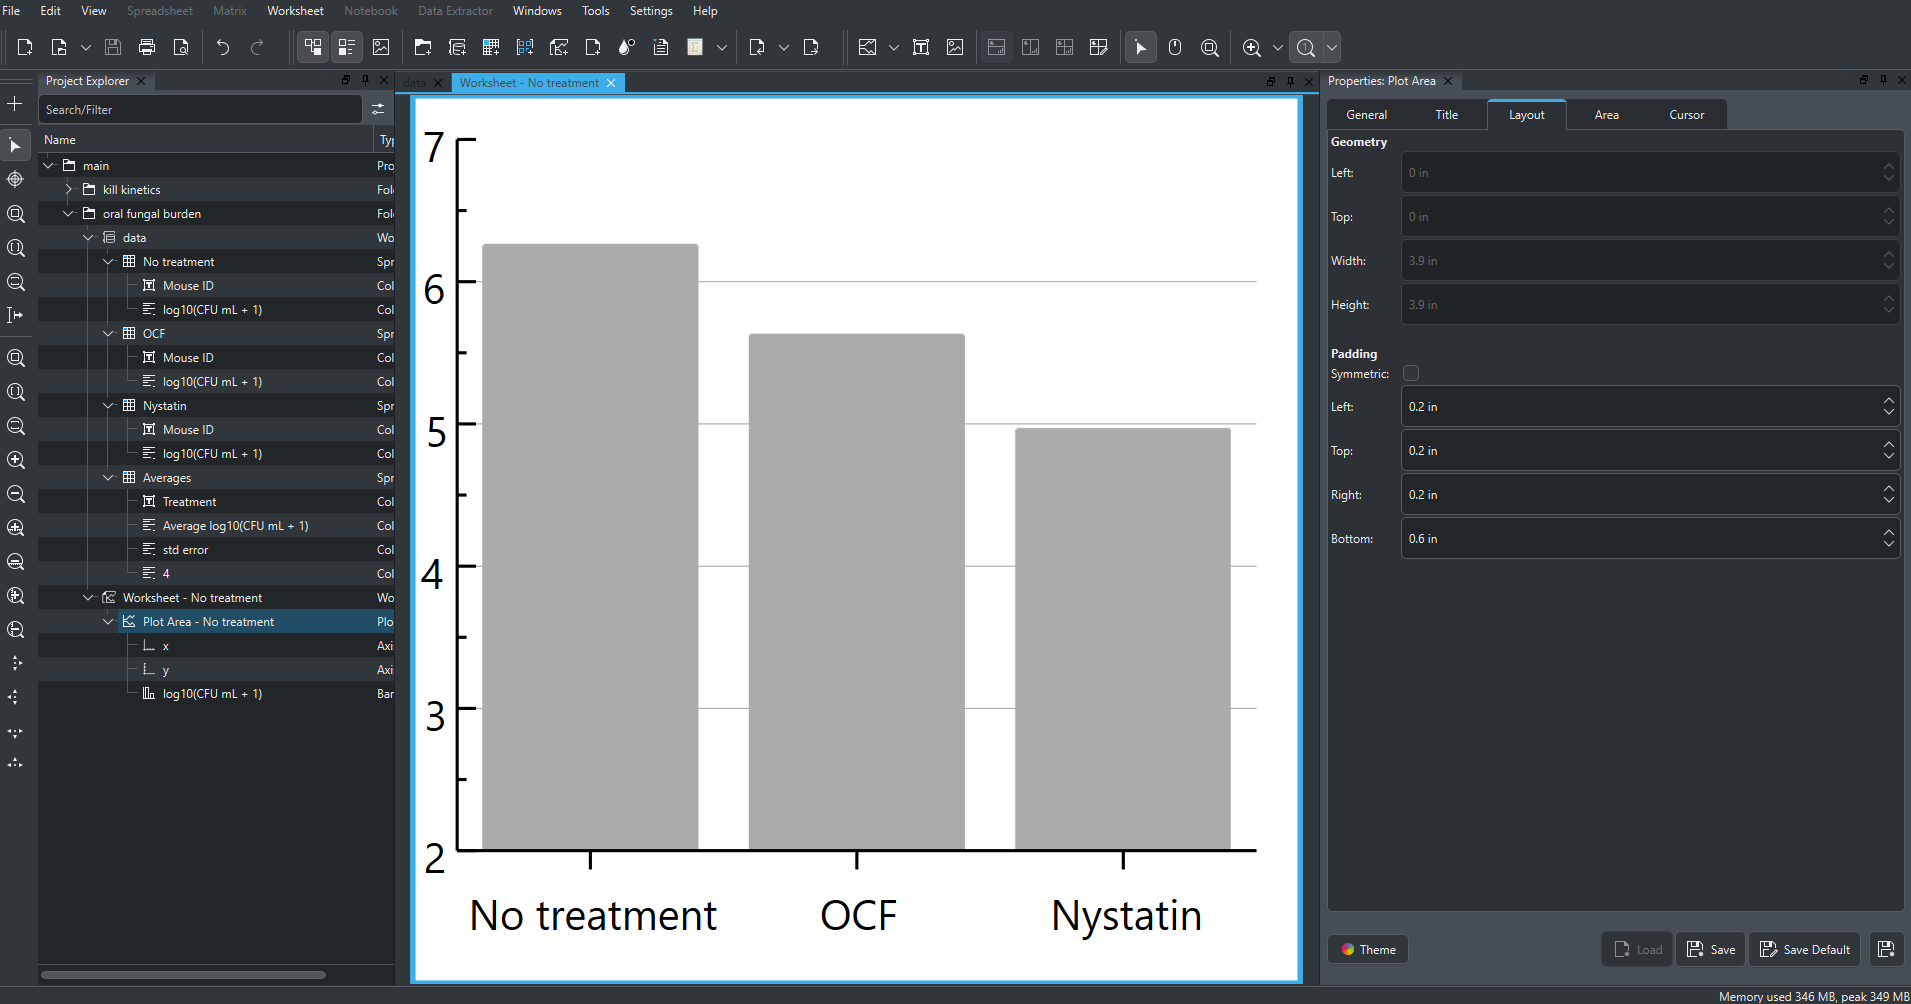
This bar plot has the average values as the height of each bar. I am looking to include, on each bar, the underlying datapoints that generated that bar, as dots. So for each bar I would include about 10 dots with a bit of jitter, with each dot representing one sample. I have yet to succeed and am looking for some help.