Plasma corrupts while gaming (Intel + Nvidia GPU)

Hello, I made a post about this issue I’m encountering on Fedora Discussion and the users suggested me to open a discussion also here.

A few months ago I installed Fedora on my MSI Thin GF63 12UCX (Intel+Nvidia GPU) but I never actually played any intensive games on in until now.

The game I’m facing most issues with is Genshin Impact (launched using a modified Wine TKG build). I’m experiencing the same issues also with other games, and sometimes with just some HW accelerated applications running (Zen browser, Cider, etc.)

I noticed that after I close a game, the entire desktop will be all glitchy / flickering.
Here’s a video of the graphical bug.
The entire desktop is also very laggy while I’m gaming (opening the tray, menus, tabs).

The only solution I found was restarting plasmashell with:

kquitapp6 plasmashell
kstart plasmashell

Which is a workaround for an issue I had in the past that caused the desktop to crash when I plugged in a secondary monitor (at the moment I just have the laptop with me).

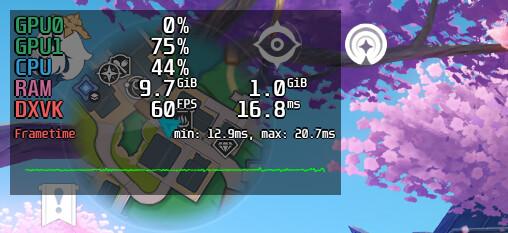
I’m sure the game runs on the 2050 (I don’t think Intel UHD can achieve that performance).
The power LED turns orange when the dedicated GPU is working (white otherwise).

The rest of the system corrupts fairly quickly if I try to open Zen Browser or other applications while playing the game. The apps and desktop freeze, but the game still works with choppy FPS (no corruption). What I usually do at that point is close all the apps and kill plasmashell, so I have just the game full-screen borderless (FPS returns to normal 60+).

When I’m finished, I just close the game, Ctrl+Alt+T and kstart plasmashell.
That pretty much restores the system to a usable state (also a reboot works too).

Did anyone experience the same issues I’m having? Do you have any suggestions?


Hardware
  • Laptop: MSI Thin GF63 12UCX

  • CPU: Intel Core i5-12450H

  • Memory: 2x8Gb DDR4 3200MHz

  • GPU1: Intel® UHD Graphics

  • GPU2: NVIDIA GeForce RTX 2050

Software
  • OS: Fedora Linux 42 KDE

  • KDE Plasma Version: 6.4.4

  • KDE Frameworks Version: 6.17.0

  • Qt Version: 6.9.1

  • Kernel Version: 6.16.7-200.fc42.x86_64 (64-bit)

  • Graphics Platform: Wayland

  • Nvidia Driver: 580.82.07

  • Kernel cmdline:

rd.luks.uuid=luks-3c2566c8-9a80-4726-88da-89051f5b4c2e rhgb quiet  intel_iommu=on rd.driver.blacklist=nouveau,nova_core modprobe.blacklist=nouveau,nova_core nvidia.NVreg_EnableS0ixPowerManagement=1"

glxinfo -B
name of display: :0
display: :0  screen: 0
direct rendering: Yes
Extended renderer info (GLX_MESA_query_renderer):
    Vendor: Intel (0x8086)
    Device: Mesa Intel(R) Graphics (ADL GT2) (0x46a3)
    Version: 25.1.7
    Accelerated: yes
    Video memory: 15680MB
    Unified memory: yes
    Preferred profile: core (0x1)
    Max core profile version: 4.6
    Max compat profile version: 4.6
    Max GLES1 profile version: 1.1
    Max GLES[23] profile version: 3.2
OpenGL vendor string: Intel
OpenGL renderer string: Mesa Intel(R) Graphics (ADL GT2)
OpenGL core profile version string: 4.6 (Core Profile) Mesa 25.1.7
OpenGL core profile shading language version string: 4.60
OpenGL core profile context flags: (none)
OpenGL core profile profile mask: core profile

OpenGL version string: 4.6 (Compatibility Profile) Mesa 25.1.7
OpenGL shading language version string: 4.60
OpenGL context flags: (none)
OpenGL profile mask: compatibility profile

OpenGL ES profile version string: OpenGL ES 3.2 Mesa 25.1.7
OpenGL ES profile shading language version string: OpenGL ES GLSL ES 3.20


Kwin support info

Pastebin

journalctl 1
kernel: Fence expiration time out i915-0000:00:02.0:QSGRenderThread[3235]:330a6!
kernel: Fence expiration time out i915-0000:00:02.0:Telegram[3599]:f4!
kernel: Fence expiration time out i915-0000:00:02.0:Renderer[5946]:3be74!
kernel: Fence expiration time out i915-0000:00:02.0:Renderer[5946]:3be76!
kernel: Fence expiration time out i915-0000:00:02.0:QSGRenderThread[21660]:2e!
kernel: Fence expiration time out i915-0000:00:02.0:QSGRenderThread[21660]:2c!
kernel: Fence expiration time out i915-0000:00:02.0:vesktop[3748]:7c4!
Cider[8899]: [8899:0912/185258.924104:ERROR:content/browser/gpu/gpu_process_host.cc:957] GPU process exited unexpectedly: exit_code=512
kernel: Fence expiration time out i915-0000:00:02.0:Cider<9124>:66666!
kernel: Fence expiration time out i915-0000:00:02.0:Cider<9124>:66668!
kernel: Fence expiration time out i915-0000:00:02.0:QSGRenderThread[3235]:330a8!
kernel: Fence expiration time out i915-0000:00:02.0:Renderer[6617]:1ba8!
Cider[21710]: [21710:0912/185318.108917:ERROR:ui/gl/gl_surface_presentation_helper.cc:260] GetVSyncParametersIfAvailable() failed for 1 times!
kernel: NVRM: nvCheckOkFailedNoLog: Check failed: Out of memory [NV_ERR_NO_MEMORY] (0x00000051) returned from _memdescAllocInternal(pMemDesc) @ mem_desc.c:1361
kernel: i915 0000:00:02.0: [drm] GPU HANG: ecode 12:1:8788faf6, in Renderer [6617]
kernel: i915 0000:00:02.0: [drm] GPU error state saved to /sys/class/drm/card1/error
kernel: i915 0000:00:02.0: [drm] Renderer[6617] context reset due to GPU hang
flatpak[6565]: [GFX1-]: Detect DeviceReset DeviceResetReason::RESET DeviceResetDetectPlace::WR_POST_UPDATE in Parent process
Cider[21710]: [21710:0912/185333.211639:ERROR:ui/gl/gl_surface_presentation_helper.cc:260] GetVSyncParametersIfAvailable() failed for 2 times!
kernel: i915 0000:00:02.0: [drm] GPU HANG: ecode 12:1:85dfffff, in QSGRenderThread [3235]
kernel: i915 0000:00:02.0: [drm] QSGRenderThread[3235] context reset due to GPU hang
Cider[21710]: [21710:0912/185342.940903:ERROR:ui/gl/gl_surface_presentation_helper.cc:260] GetVSyncParametersIfAvailable() failed for 3 times!
wireplumber[2830]: wp-event-dispatcher: <WpAsyncEventHook:0x5653737c55e0> failed: <WpSiStandardLink:0x565373749480> link failed: some node was destroyed before th>
plasmashell[3031]: KPackageStructure of KPluginMetaData(pluginId:"thot.observer.cpu", fileName: "/home/martino/.local/share/plasma/plasmoids/thot.observer.cpu/met>
plasmashell[3031]: KPackageStructure of KPluginMetaData(pluginId:"org.kde.netspeedWidget", fileName: "/home/martino/.local/share/plasma/plasmoids/org.kde.netspeed>
systemd[2567]: app-flatpak-app.zen_browser.zen-3959674464.scope: Consumed 32min 57.515s CPU time, 4G memory peak, 191M memory swap peak.

journalctl 2
Cider[8899]: [8899:0912/185546.225532:ERROR:content/browser/gpu/gpu_process_host.cc:957] GPU process exited unexpectedly: exit_code=512 
kernel: i915 0000:00:02.0: [drm] GPU HANG: ecode 12:1:85dffffd, in Xwayland [2941] 
kernel: i915 0000:00:02.0: [drm] Xwayland[2941] context reset due to GPU hang 
Cider[22276]: [22276:0912/185555.004827:ERROR:ui/gl/gl_surface_presentation_helper.cc:260] GetVSyncParametersIfAvailable() failed for 1 times! 
kernel: i915 0000:00:02.0: [drm] GPU HANG: ecode 12:1:85dfbfff, in Xwayland [2941] 
kernel: i915 0000:00:02.0: [drm] Xwayland[2941] context reset due to GPU hang 
Cider[22276]: [22276:0912/185602.853472:ERROR:ui/gl/gl_surface_presentation_helper.cc:260] GetVSyncParametersIfAvailable() failed for 2 times! 
plasmashell[3031]: file:///usr/share/plasma/plasmoids/org.kde.plasma.taskmanager/contents/ui/ToolTipInstance.qml:346:9: QML Image: Cannot open: file:///tmp/.org.c> 
kernel: NVRM: nvCheckOkFailedNoLog: Check failed: Out of memory [NV_ERR_NO_MEMORY] (0x00000051) returned from _memdescAllocInternal(pMemDesc) @ mem_desc.c:1361

Today, I tried reinstalling the latest NVIDIA drivers with:

sudo dnf remove akmod-nvidia xorg-x11-drv-nvidia\*
% Reboot

flatpak update 
% Removes the following Nvidia packages:
% org.freedesktop.Platform.GL32.nvidia-580-82-07
% org.freedesktop.Platform.GL.nvidia-580-82-07
% org.freedesktop.Platform.VAAPI.nvidia
% Reboot

sudo dnf install akmod-nvidia xorg-x11-drv-nvidia-cuda
% reboot

flatpak update % Re-adds Nvidia packages

I still encountered the same issues and the laptop even crashed completely.

The speakers completely stopped working, and I had to reset the EC using the procedure provided by MSI, in order to reinitialize the audio controller.

On other occasions, the PC would crash, and then the games were opening in a black window (audio and controls were okay, there was just no output). To this problem, usually it’s enough to log out and back into the session (restarting doesn’t work for some reason).

In the end, I tried kquitapp6 plasmashell before launching the game, and it was totally stable, probably even smoother than usual (and it also seemed to have faster loading times).

Any idea on how to diagnose this? Everything, even the volume slider popup, can lead to crashes.

The kernel log seeems to suggest you’re GPU is having trouble (not clear which, expect that there’s an Nvidia memory weird).

Can you please post the output of lspci as well as the output of kinfo (or use Info Center Copy Details)?

Sure, here’s some more info that might be useful:

kinfo
Operating System: Fedora Linux 42 
KDE Plasma Version: 6.4.4 
KDE Frameworks Version: 6.17.0 
Qt Version: 6.9.1 
Kernel Version: 6.16.7-200.fc42.x86_64 (64-bit) 
Graphics Platform: Wayland 
Processors: 12 × 12th Gen Intel® Core™ i5-12450H 
Memory: 16 GiB of RAM (15.3 GiB usable) 
Graphics Processor 1: Intel® Graphics 
Graphics Processor 2: NVIDIA GeForce RTX 2050 
lspci
00:00.0 Host bridge: Intel Corporation 12th Gen Core Processor Host Bridge/DRAM Registers (rev 02)
00:01.0 PCI bridge: Intel Corporation 12th Gen Core Processor PCI Express x16 Controller #1 (rev 02)
00:02.0 VGA compatible controller: Intel Corporation Alder Lake-P GT1 [UHD Graphics] (rev 0c)
00:04.0 Signal processing controller: Intel Corporation Alder Lake Innovation Platform Framework Processor Participant (rev 02)
00:06.0 PCI bridge: Intel Corporation 12th Gen Core Processor PCI Express x4 Controller #0 (rev 02)
00:06.2 PCI bridge: Intel Corporation 12th Gen Core Processor PCI Express x4 Controller #2 (rev 02)
00:08.0 System peripheral: Intel Corporation 12th Gen Core Processor Gaussian & Neural Accelerator (rev 02)
00:14.0 USB controller: Intel Corporation Alder Lake PCH USB 3.2 xHCI Host Controller (rev 01)
00:14.2 RAM memory: Intel Corporation Alder Lake PCH Shared SRAM (rev 01)
00:14.3 Network controller: Intel Corporation Alder Lake-P PCH CNVi WiFi (rev 01)
00:15.0 Serial bus controller: Intel Corporation Alder Lake PCH Serial IO I2C Controller #0 (rev 01)
00:16.0 Communication controller: Intel Corporation Alder Lake PCH HECI Controller (rev 01)
00:17.0 SATA controller: Intel Corporation Alder Lake-P SATA AHCI Controller (rev 01)
00:1c.0 PCI bridge: Intel Corporation Alder Lake-P PCH PCIe Root Port #6 (rev 01)
00:1f.0 ISA bridge: Intel Corporation Alder Lake PCH eSPI Controller (rev 01)
00:1f.3 Multimedia audio controller: Intel Corporation Alder Lake PCH-P High Definition Audio Controller (rev 01)
00:1f.4 SMBus: Intel Corporation Alder Lake PCH-P SMBus Host Controller (rev 01)
00:1f.5 Serial bus controller: Intel Corporation Alder Lake-P PCH SPI Controller (rev 01)
01:00.0 VGA compatible controller: NVIDIA Corporation GA107 [GeForce RTX 2050] (rev a1)
01:00.1 Audio device: NVIDIA Corporation GA107 High Definition Audio Controller (rev a1)
03:00.0 Non-Volatile memory controller: Samsung Electronics Co Ltd NVMe SSD Controller PM9B1 (DRAM-less) (rev 02)
04:00.0 Ethernet controller: Realtek Semiconductor Co., Ltd. RTL8111/8168/8211/8411 PCI Express Gigabit Ethernet Controller (rev 15)

cat /proc/driver/nvidia/version
NVRM version: NVIDIA UNIX Open Kernel Module for x86_64  580.82.07  
Release Build  (dvs-builder@U22-I3-B07-03-2)  Wed Aug 27 18:20:54 UTC 2025
GCC version:  gcc version 15.2.1 20250808 (Red Hat 15.2.1-1) (GCC) 

lsmod | grep nvidia
nvidia_uvm           4206592  0
nvidia_drm            155648  1
nvidia_modeset       2174976  1 nvidia_drm
nvidia              15855616  14 nvidia_uvm,nvidia_modeset
drm_ttm_helper         16384  2 nvidia_drm,xe
video                  81920  4 msi_wmi,xe,i915,nvidia_modeset

The game is running under a patched version of Wine TKG 10.14, using DXVK 2.7.

Also, here’s another game crash log:

journalctl
kernel: GenshinImpact.e: vmemmap alloc failure: order:9, mode:0x4cc0(GFP_KERNEL|__GFP_RETRY_MAYFAIL), nodemask=(null),cpuset=/,mems_allowed=0
kernel: CPU: 0 UID: 1000 PID: 9425 Comm: GenshinImpact.e Tainted: G           O        6.16.7-200.fc42.x86_64 #1 PREEMPT(lazy)
kernel: Tainted: [O]=OOT_MODULE
kernel: Hardware name: Micro-Star International Co., Ltd. Thin GF63 12UCX/MS-16R8, BIOS E16R8IMS.117 02/27/2025
kernel: Call Trace:
kernel:  <TASK>
kernel:  dump_stack_lvl+0x5d/0x80
kernel:  warn_alloc+0x163/0x190
kernel:  vmemmap_alloc_block+0xd2/0xe0
kernel:  vmemmap_populate_hugepages+0xef/0x1a0
kernel:  vmemmap_populate+0x54/0x90
kernel:  __populate_section_memmap+0xb9/0xd0
kernel:  section_activate+0x14f/0x260
kernel:  sparse_add_section+0x33/0x150
kernel:  __add_pages+0x9d/0x120
kernel:  add_pages+0x28/0x80
kernel:  pagemap_range+0x2c8/0x3d0
kernel:  memremap_pages+0x10d/0x280
kernel:  devmem_alloc_pagemap+0xcc/0x1c0 [nvidia_uvm]
kernel:  uvm_pmm_devmem_init+0xce/0xf0 [nvidia_uvm]
kernel:  ? uvm_mmu_init_gpu_chunk_sizes+0x8d/0xa0 [nvidia_uvm]
kernel:  init_parent_gpu+0x178/0x510 [nvidia_uvm]
kernel:  add_gpu+0x4c3/0x800 [nvidia_uvm]
kernel:  gpu_retain_by_uuid_locked.isra.0+0x1a8/0x2b0 [nvidia_uvm]
kernel:  uvm_gpu_retain_by_uuid+0x3b/0x60 [nvidia_uvm]
kernel:  uvm_va_space_register_gpu+0x50/0xb40 [nvidia_uvm]
kernel:  ? mas_wr_store_entry+0x1be/0x370
kernel:  uvm_api_register_gpu+0x72/0xb0 [nvidia_uvm]
kernel:  uvm_ioctl+0x1462/0x1e20 [nvidia_uvm]
kernel:  ? thread_context_non_interrupt_add+0x131/0x230 [nvidia_uvm]
kernel:  uvm_unlocked_ioctl_entry.part.0+0x75/0xe0 [nvidia_uvm]
kernel:  __x64_sys_ioctl+0x94/0xe0
kernel:  do_syscall_64+0x7e/0x250
kernel:  ? mntput_no_expire+0x4b/0x290
kernel:  ? lookup_dcache+0x21/0x80
kernel:  ? dput+0x34/0x1c0
kernel:  ? filename_create+0x111/0x180
kernel:  ? do_mkdirat+0xe9/0x190
kernel:  ? __x64_sys_mkdir+0x49/0x70
kernel:  ? do_syscall_64+0xb6/0x250
kernel:  ? count_memcg_events+0x15d/0x230
kernel:  ? handle_mm_fault+0x248/0x360
kernel:  ? do_user_addr_fault+0x21a/0x690
kernel:  ? irqentry_exit_to_user_mode+0x2c/0x1c0
kernel:  entry_SYSCALL_64_after_hwframe+0x76/0x7e
kernel: RIP: 0033:0x7f4f15fba88d
kernel: Code: 04 25 28 00 00 00 48 89 45 c8 31 c0 48 8d 45 10 c7 45 b0 10 00 00 00 48 89 45 b8 48 8d 45 d0 48 89 45 c0 b8 10 00 00 00 0f 05 <89> c2 3d 00 f0 ff ff>
kernel: RSP: 002b:00000001000fc400 EFLAGS: 00000246 ORIG_RAX: 0000000000000010
kernel: RAX: ffffffffffffffda RBX: 00007f4e357cf338 RCX: 00007f4f15fba88d
kernel: RDX: 00000001000fc490 RSI: 0000000000000025 RDI: 00000000000000eb
kernel: RBP: 00000001000fc450 R08: 000055555c8b8370 R09: 0000000000000000
kernel: R10: 000055555c8b82f0 R11: 0000000000000246 R12: 00000001000fc490
kernel: R13: 00000000000000eb R14: 000055555c88fff6 R15: 00007f4e357d3cd8
kernel:  </TASK>
kernel: Mem-Info:
kernel: active_anon:405148 inactive_anon:1328974 isolated_anon:0
                                active_file:252816 inactive_file:1584419 isolated_file:0
                                unevictable:113656 dirty:916 writeback:0
                                slab_reclaimable:43405 slab_unreclaimable:72898
                                mapped:467212 shmem:476950 pagetables:23701
                                sec_pagetables:1371 bounce:0
                                kernel_misc_reclaimable:0
                                free:74249 free_pcp:11 free_cma:0
kernel: Node 0 active_anon:1620592kB inactive_anon:5315896kB active_file:1011264kB inactive_file:6337676kB unevictable:454624kB isolated(anon):0kB isolated(file):>
kernel: Node 0 DMA free:13312kB boost:0kB min:64kB low:80kB high:96kB reserved_highatomic:0KB free_highatomic:0KB active_anon:0kB inactive_anon:0kB active_file:0k>
kernel: lowmem_reserve[]: 0 1480 15665 15665 15665
kernel: Node 0 DMA32 free:85672kB boost:0kB min:5700kB low:7124kB high:8548kB reserved_highatomic:0KB free_highatomic:0KB active_anon:192896kB inactive_anon:67034>
kernel: lowmem_reserve[]: 0 0 14185 14185 14185
kernel: Node 0 Normal free:198012kB boost:0kB min:61812kB low:77264kB high:92716kB reserved_highatomic:0KB free_highatomic:0KB active_anon:1427488kB inactive_anon>
kernel: lowmem_reserve[]: 0 0 0 0 0
kernel: Node 0 DMA: 0*4kB 0*8kB 0*16kB 0*32kB 0*64kB 0*128kB 0*256kB 0*512kB 1*1024kB (U) 2*2048kB (UM) 2*4096kB (M) = 13312kB
kernel: Node 0 DMA32: 1413*4kB (UME) 1726*8kB (UME) 1070*16kB (UME) 550*32kB (UME) 236*64kB (UME) 86*128kB (UME) 3*256kB (M) 1*512kB (M) 4*1024kB (M) 0*2048kB 0*4>
kernel: Node 0 Normal: 5746*4kB (UME) 1603*8kB (UME) 2768*16kB (UME) 1391*32kB (UM) 497*64kB (UM) 155*128kB (UM) 44*256kB (UM) 14*512kB (UM) 3*1024kB (M) 0*2048kB>
kernel: Node 0 hugepages_total=0 hugepages_free=0 hugepages_surp=0 hugepages_size=1048576kB
kernel: Node 0 hugepages_total=0 hugepages_free=0 hugepages_surp=0 hugepages_size=2048kB
kernel: 2314184 total pagecache pages
kernel: 0 pages in swap cache
kernel: Free swap  = 8388544kB
kernel: Total swap = 8388604kB
kernel: 4117839 pages RAM
kernel: 0 pages HighMem/MovableOnly
kernel: 103608 pages reserved
kernel: 0 pages cma reserved
kernel: 0 pages hwpoisoned
kernel: NVRM: nvCheckOkFailedNoLog: Check failed: Out of memory [NV_ERR_NO_MEMORY] (0x00000051) returned from _memdescAllocInternal(pMemDesc) @ mem_desc.c:1361
kernel: NVRM: nvCheckOkFailedNoLog: Check failed: Out of memory [NV_ERR_NO_MEMORY] (0x00000051) returned from rmStatus @ system_mem.c:353
kernel: NVRM: nvAssertOkFailedNoLog: Assertion failed: Out of memory [NV_ERR_NO_MEMORY] (0x00000051) returned from pRmApi->Alloc(pRmApi, device->session->handle, >

The problem seems to be that the Nvidia driver tries to allocate kernel memory and fails due to out of memory.

Are you using a swap partition? If not - can you try activating swap before you play the game?

Fedora by defaults creates a swap partition that is 100% of RAM size (Max 8Gb)

swapon --show 
NAME       TYPE      SIZE USED PRIO 
/dev/zram0 partition   8G   0B  100 


free -h
               total        used        free      shared  buff/cache   available
Mem:            15Gi       6,2Gi       3,0Gi       1,6Gi       8,1Gi       9,1Gi
Swap:          8,0Gi       1,7Gi       6,3Gi 

I tried enabling MangoHud, but everything looks fine in-game:

If I try to open Zen for example, RAM goes to 12Gb, but FPS drops to <40 (GPU utilization remains the same). Sometimes I get the usual corruption, others the PC will completely lock up during loading screens (hard reset + EC reset required to fix audio).

It might be that its running out of kernel memory (which is more limited than the user space memory), but at this point I’m out of my depth.

Maybe a kwin developer can happen by and will have some more suggestions.

1 Like

Another strange symptom that is starting to happen more often is that the games will open, but the window is black. (I can hear the game and I can interact with the main menu).
This happens on both full-screen and windowed mode.

I still couldn’t find a reliable way to fix it, sometimes it works, others it does not. It’s up to the laptop whether it wants to take the output from the 2050 and draw it on the display.
(I played for 4 hours straight yesterday, this morning the game didn’t open, no updates in between).

Also, corruption just happens on every HW accelerated application, basically. For example, this is what happened while I was trying to write an email on Thunderbird (the app in the background was Zen, so all Flatpaks).

There is absolutely nothing journalctl.

At this point, I think I might need to find a USB drive so I can use a Live ISO for a few days and see what the hardware does with an older image.