Hi I am new to Labplot and have been following this tutorial on how to use custom x-axis labels: LabPlot/Tutorials/Plotting/PlotTextData - KDE UserBase Wiki . However, the Spacing option can only take two values, the default 10 and 0.5 and not 1. This makes my plot axis look sparse and very cramped. I have 30 labels I would like to include.
Please help figuring out what I may be doing wrong.
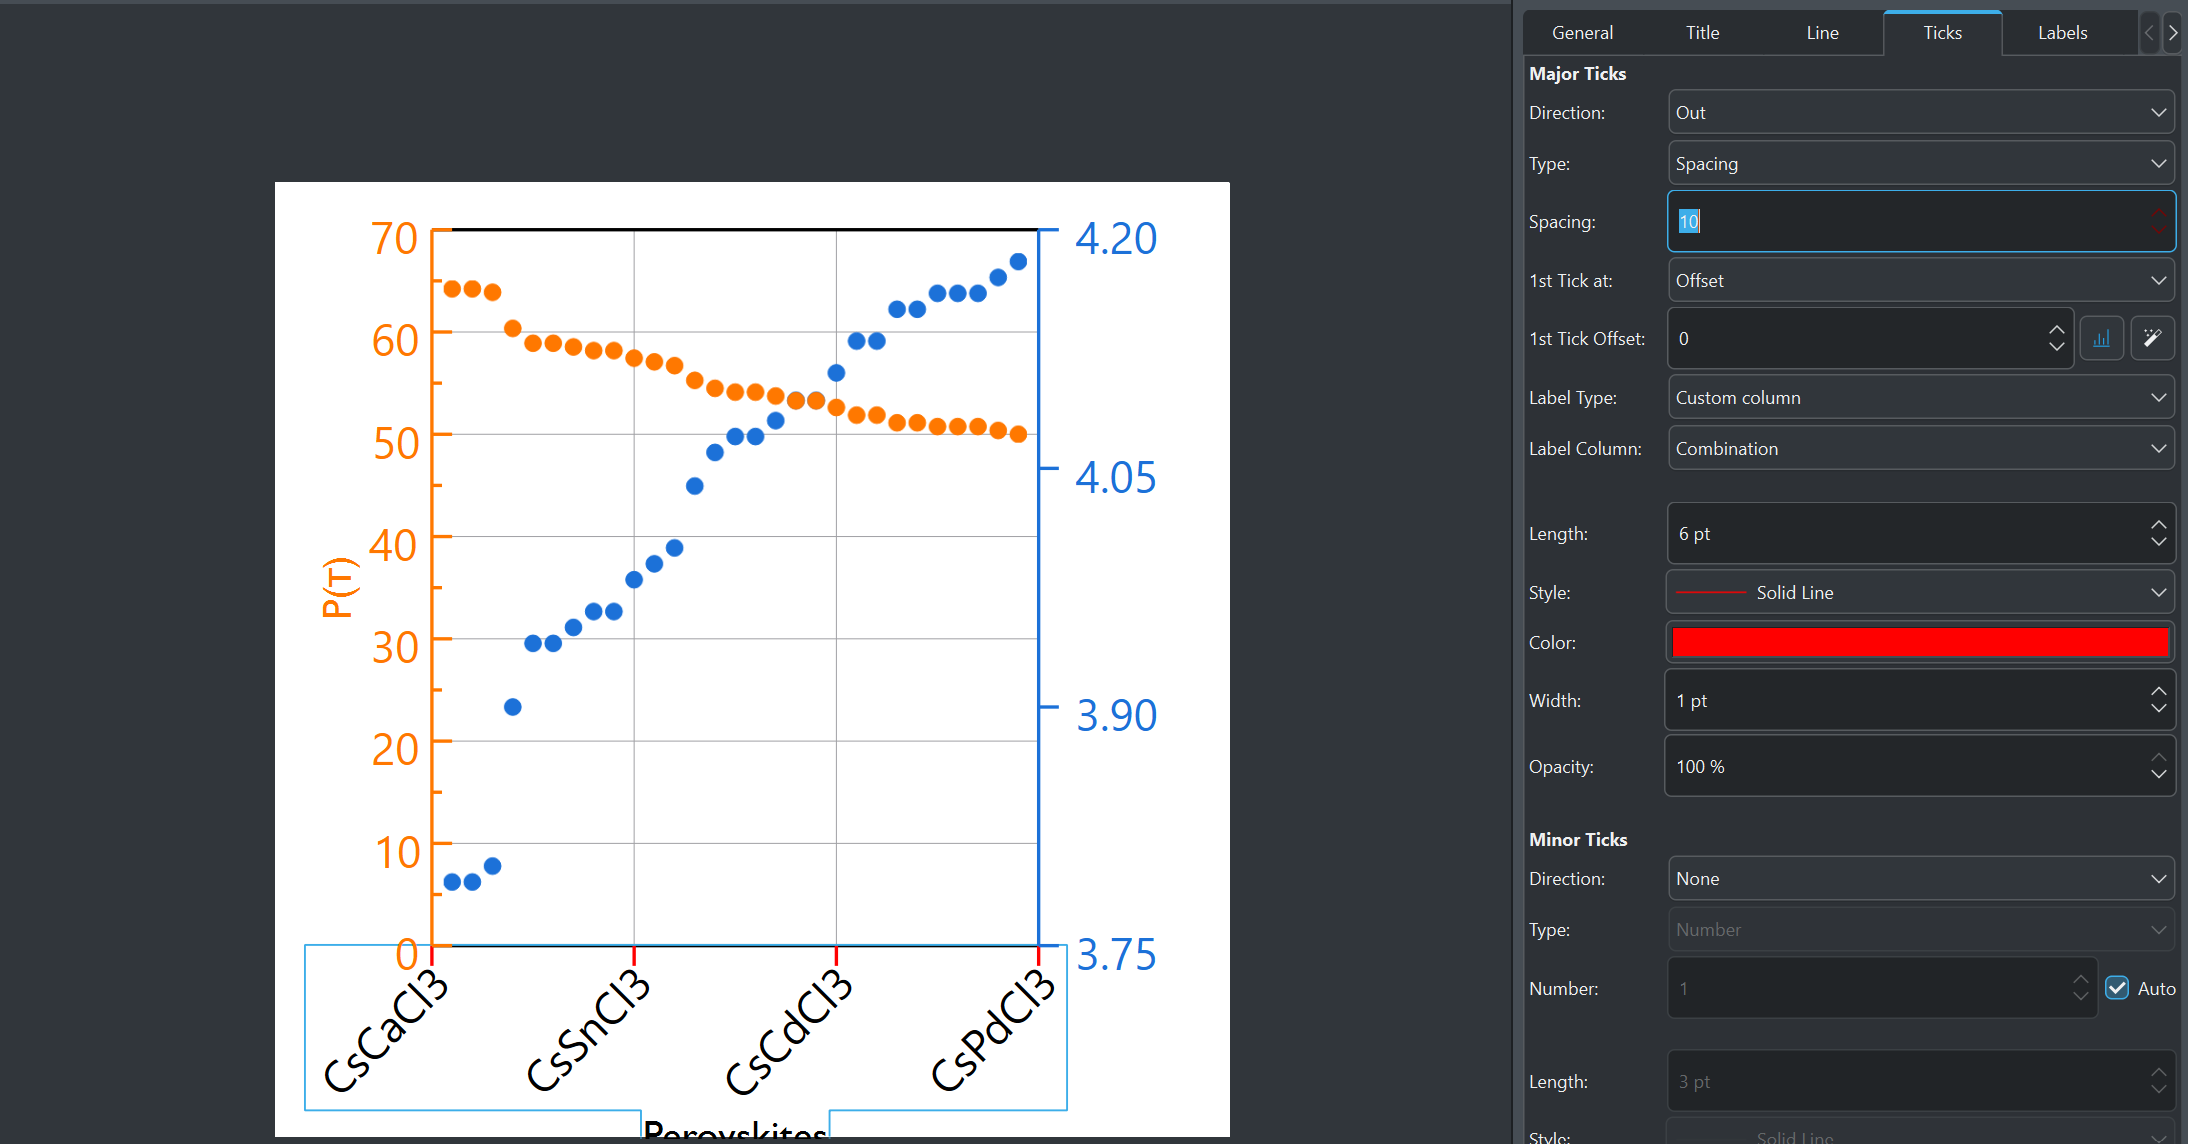
The type determines at which position the tick is created. In your case every 0.5.
The label type determines which label shall be used at those ticks. For the first tick the first label in the spreadsheet and so on.
In common scenarios you wanna have ticks at predefined positions determined in a column in a spreadsheet and selecting as typeCustom Column and selecting the column in the upcomming Selection Box.
In the label type selction you use also Custom Columnand select the desired column.
I personally create a tickLabel Spreadsheet with two columns. First column the tick positions as doubleor integer type and a second column with the labels using Text as column type