High Memory Usage from Plasmashell. Is it a memory leak?

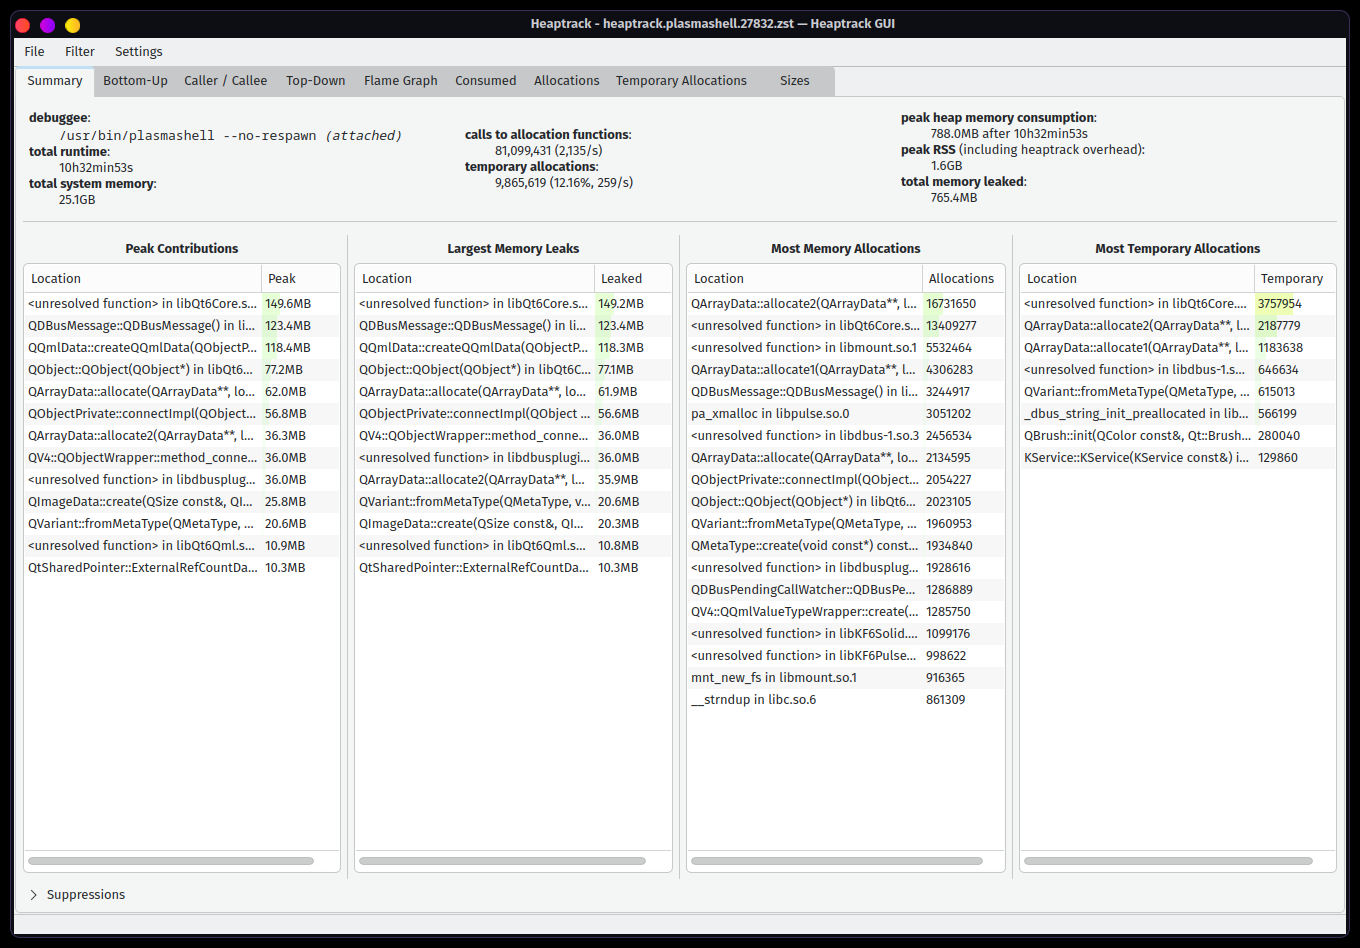
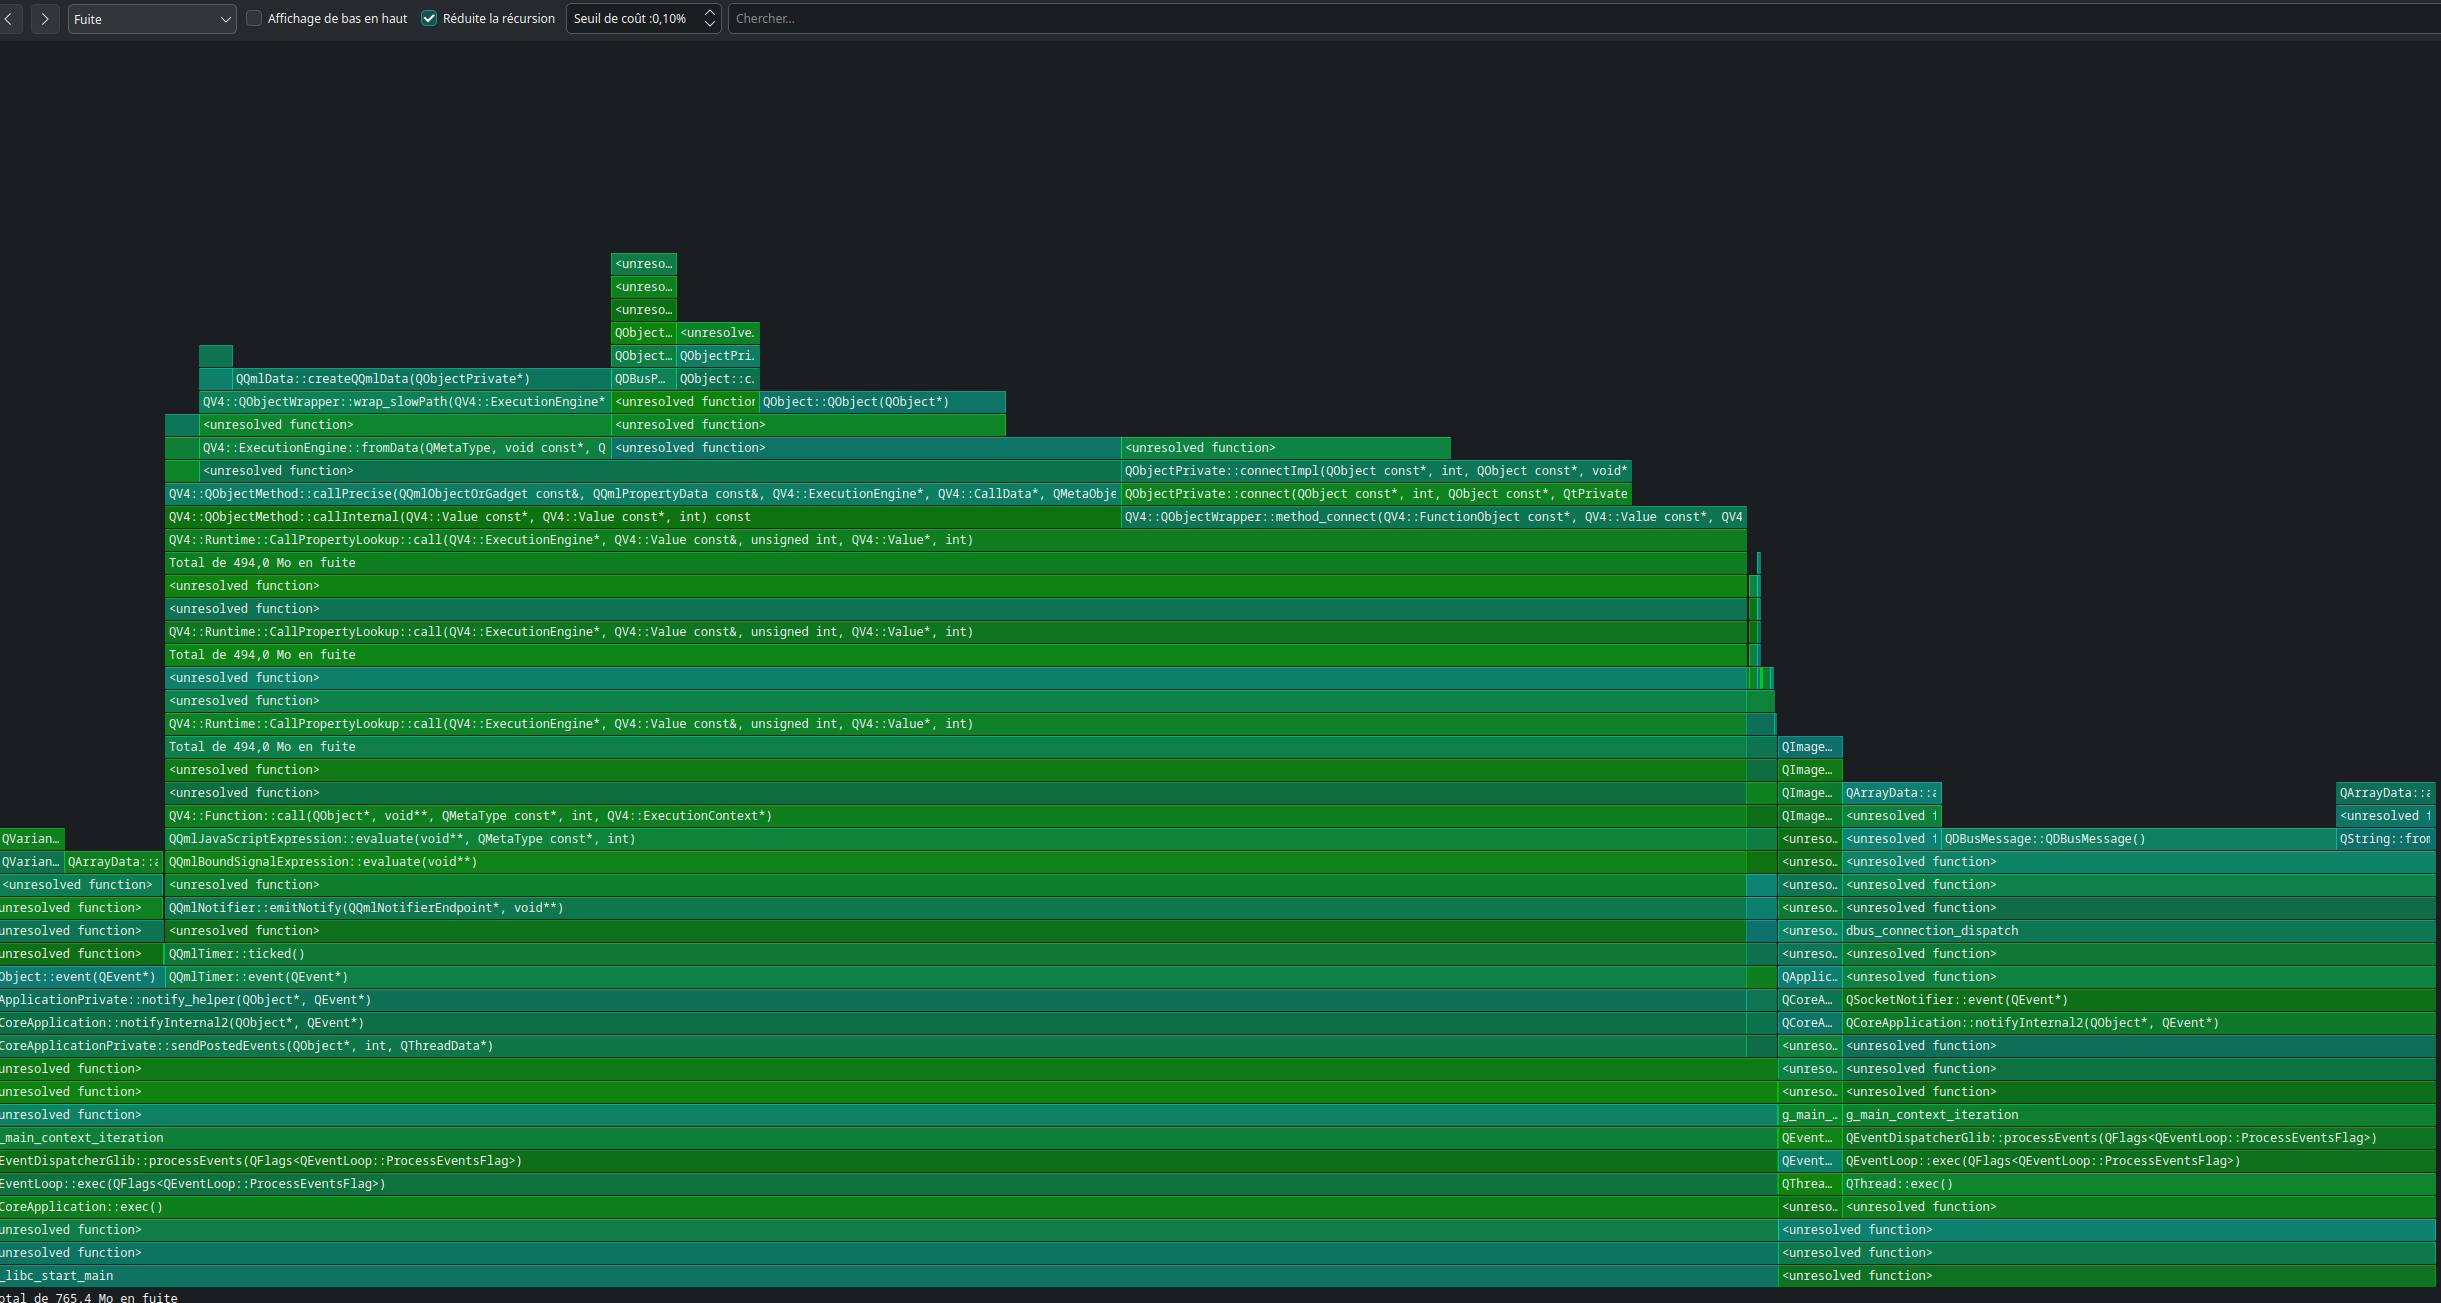
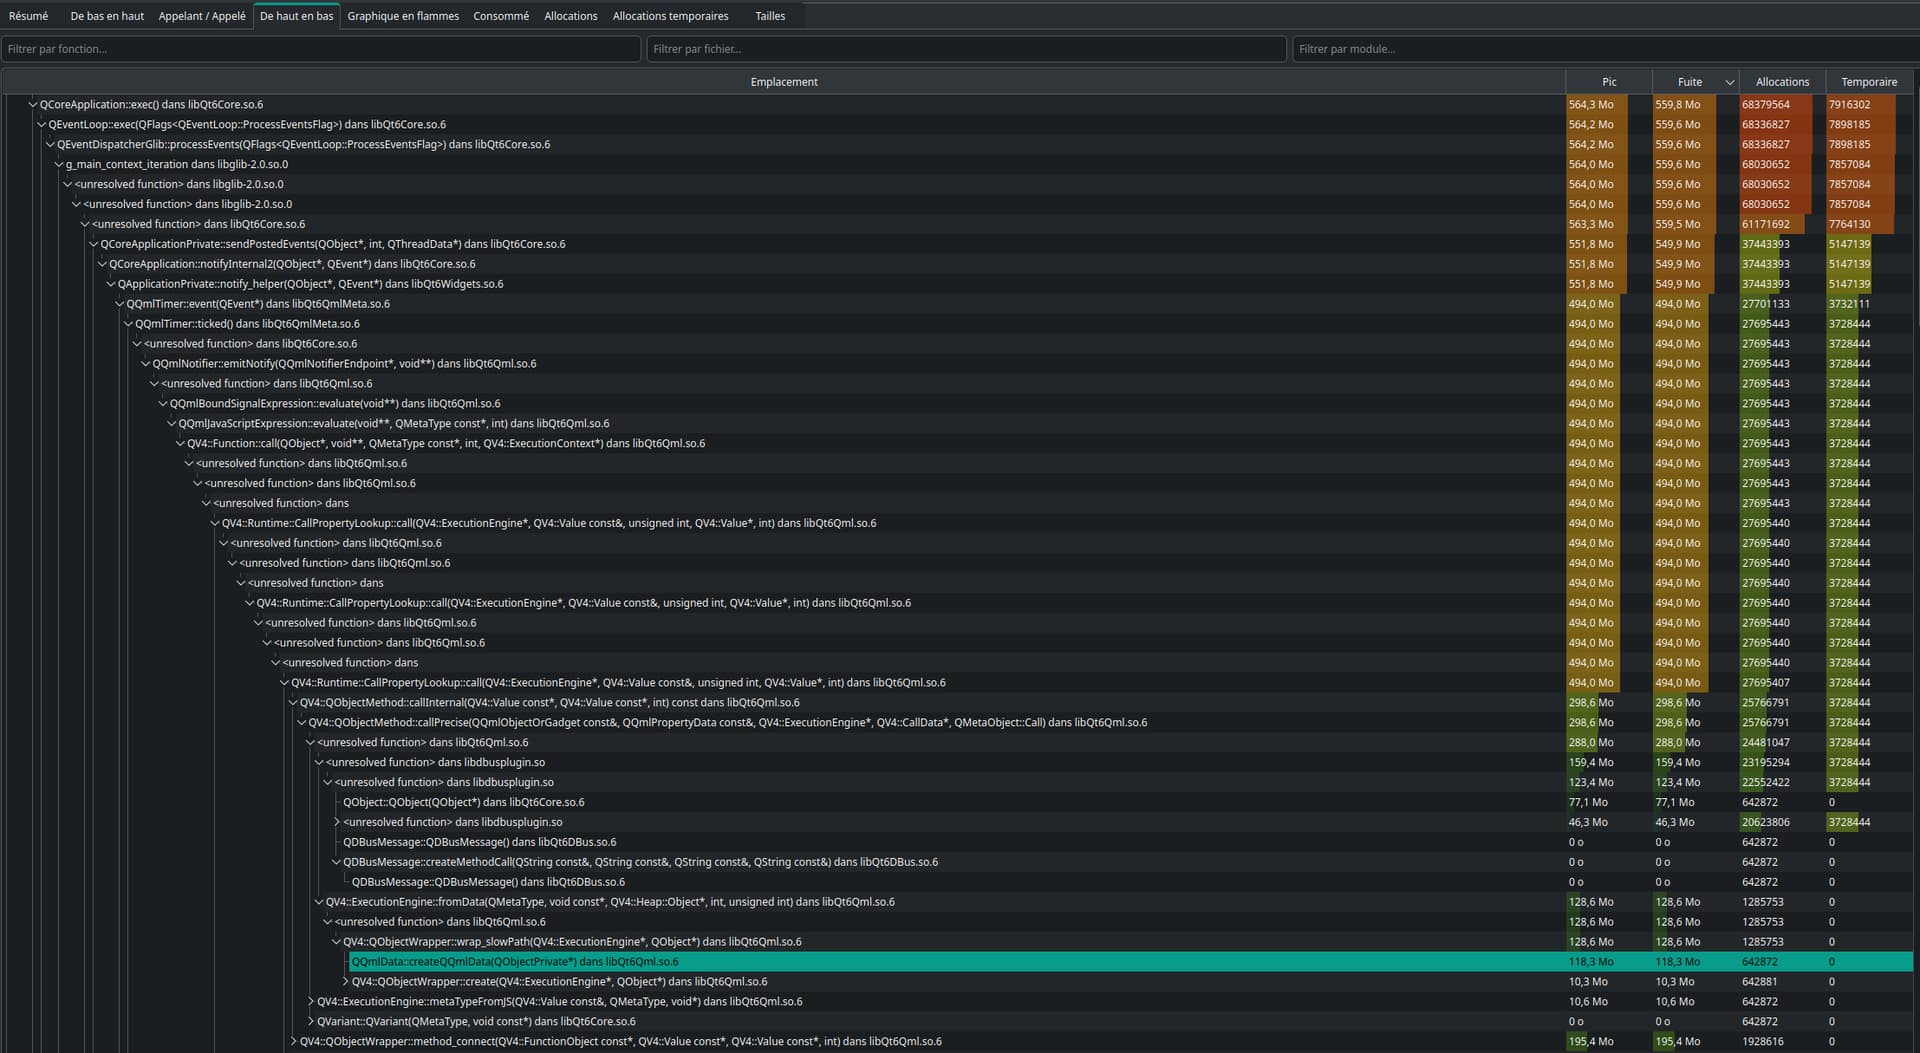
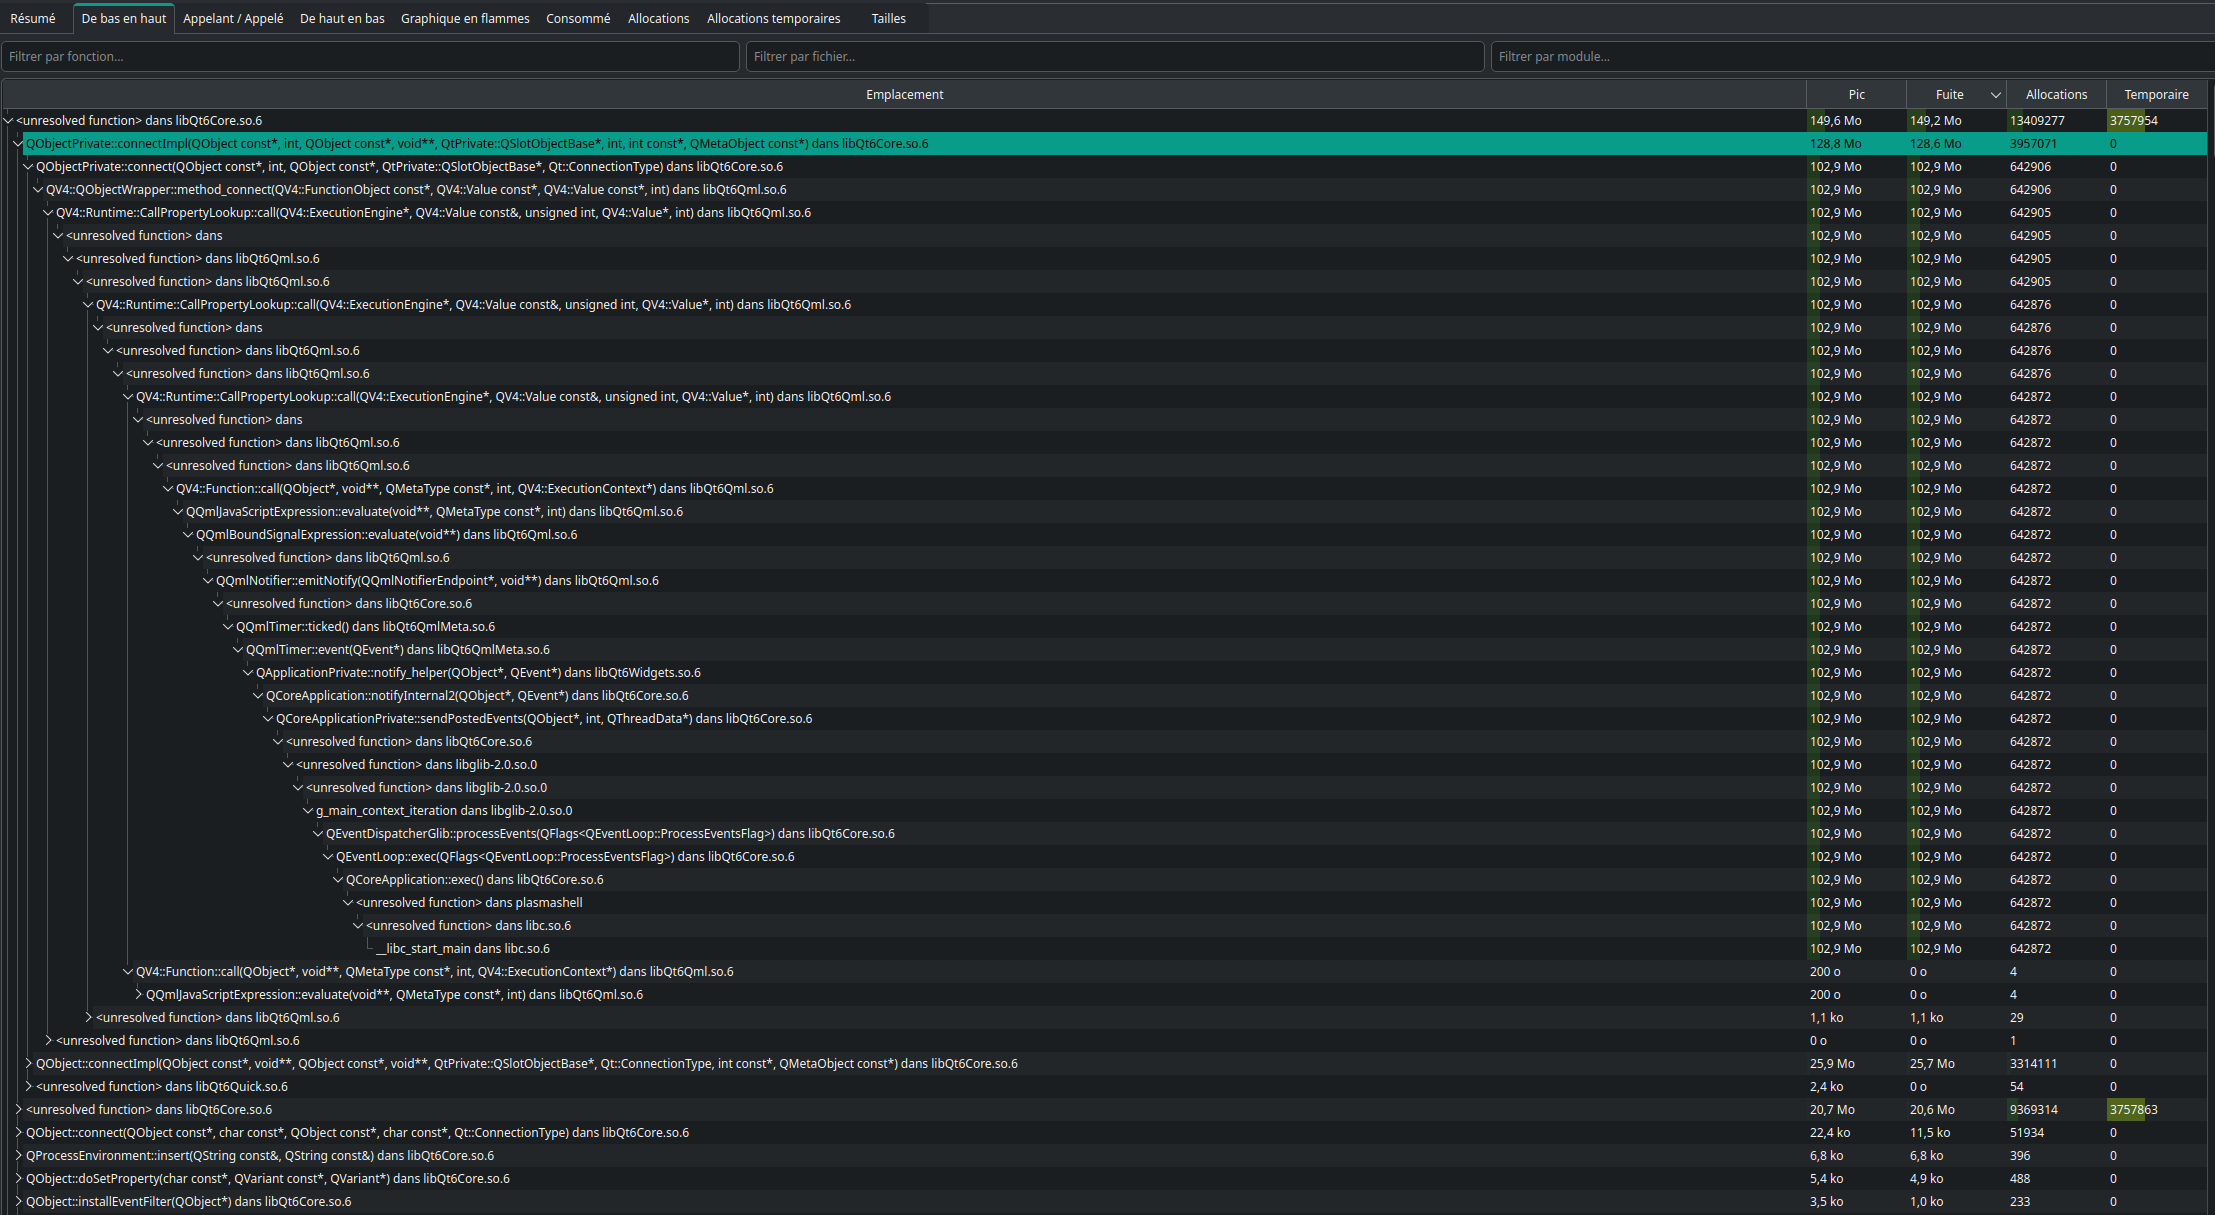
I may have found a memory with plasmashell but I want to make sure before I decide to post a bug report.

Severity: One time, my device memory usage was extremely high even though I had only firefox open with 5 tabs (3-4 inactive tabs), then my device restarted automatically and I think it’s because the memory usage reached the maximum memory on the device (16GB). Hence why I want to fix this issue so it doesn’t happen again.

  • When I start my machine, plasmashell uses about 300MB (normal). But after a few days, I noticed it goes up to 3GB and it could possibly go higher.
  • I used valgrind --leak-check=full --show-leak-kinds=all --log-file='valgrind_logs_plasmashell.txt' plasmashell to see if there were memory leaks and there were +100,000 lines in the log file. Here is the summary:
==12105== LEAK SUMMARY:
==12105==    definitely lost: 280 bytes in 2 blocks
==12105==    indirectly lost: 2,542 bytes in 24 blocks
==12105==      possibly lost: 1,440 bytes in 5 blocks
==12105==    still reachable: 887,892 bytes in 8,067 blocks
==12105==                       of which reachable via heuristic:
==12105==                         newarray           : 3,344 bytes in 22 blocks
==12105==         suppressed: 0 bytes in 0 blocks
==12105== 
==12105== For lists of detected and suppressed errors, rerun with: -s
==12105== ERROR SUMMARY: 14 errors from 14 contexts (suppressed: 0 from 0)

Debugging Plasmashell:

  • I followed the instructions in: [Plasma/Debugging - KDE Community Wiki]
  • I found that clicking on the default widgets (for me it is Volume, Bluetooth, Wifi, Battery and Calendar) to open the pop-up window and then clicking on it again to close it, increases the memory usage a bit. This log also appeared whenever I did it: The cached device pixel ratio value was stale on window update. Please file a QTBUG which explains how to reproduce.
  • I repeatedly kept doing it (constantly clicking on the widgets to open and close the pop-up windows), the same log appeared and the memory usage kept on increasing (went from 17.2% to 17.6%).
  • Then eventually the pop-up window stopped appearing when I clicked on the widgets and this log started appearing instead of the previous one: qt.qpa.wayland: eglSwapBuffers failed with 0x3000, surface: 0x637b10f00d20. This same log appeared when I clicked on all the widgets that I mentioned earlier and their pop-up windows did not appear at all.
  • After waiting a while, I did it again and the pop-up window did appear but when I clicked the widget again to close the window, the panel disappeared (like it got hidden) and then these logs started appearing:
Feb 01 04:17:37 my_device plasmashell[1094]: The Wayland connection experienced a fatal error: Too many open files
Feb 01 04:17:38 my_device plasmashell[180735]: KPackageStructure of KPluginMetaData(pluginId:"org.kde.plasma.kclock_1x2", fileName: "/usr/share/plasma/plasmoids/org.kde.plasma.kclock_1x2/metadata.json") does not match requested format "Plasma/Applet"
Feb 01 04:17:38 my_device plasmashell[180735]: kf.plasma.quick: Applet preload policy set to 1
Feb 01 04:17:38 my_device plasmashell[180735]: qml: false
Feb 01 04:17:38 my_device plasmashell[180735]: file:///usr/share/plasma/plasmoids/org.kde.desktopcontainment/contents/ui/main.qml:178:25: QML FolderViewDropArea (parent or ancestor of QQuickLayoutAttached): Binding loop detected for property "minimumWidth":
                                                                                    file:///usr/share/plasma/plasmoids/org.kde.desktopcontainment/contents/ui/main.qml:201:9
Feb 01 04:17:38 my_device plasmashell[180735]: Toolbox not loading, toolbox package is either invalid or disabled.
Feb 01 04:17:39 my_device plasmashell[180735]: org.kde.plasma.kicker: Entry is not valid "org.kde.kontact.desktop" 0x5fe7a9a05220
Feb 01 04:17:39 my_device plasmashell[180735]: org.kde.plasma.kicker: Entry is not valid "org.kde.discover.desktop" 0x5fe7a9a05220
Feb 01 04:17:39 my_device plasmashell[180735]: org.kde.plasma.kicker: Entry is not valid "org.kde.kontact.desktop" 0x5fe7a9a05220
Feb 01 04:17:39 my_device plasmashell[180735]: org.kde.plasma.kicker: Entry is not valid "org.kde.discover.desktop" 0x5fe7a9a05220
Feb 01 04:17:39 my_device plasmashell[180735]: file:///usr/share/plasma/plasmoids/org.kde.plasma.private.systemtray/contents/ui/main.qml:50:9: QML KSortFilterProxyModel: Binding loop detected for property "sourceModel"
Feb 01 04:17:39 my_device plasmashell[180735]: QFont::setPointSizeF: Point size <= 0 (0.000000), must be greater than 0
Feb 01 04:17:50 my_device plasmashell[180735]: The cached device pixel ratio value was stale on window update.  Please file a QTBUG which explains how to reproduce.
  • After the last log got printed, the panel appeared again and I noticed that the plasmashell memory usage has dropped down to ~300MB (I think it restarted automatically since I kept clicking on the widgets too many times in a short period)

My Device Information (inxi -Fz):

System:
  Kernel: 6.12.10-arch1-1 arch: x86_64 bits: 64
  Desktop: KDE Plasma v: 6.2.5 Distro: EndeavourOS
Machine:
  Type: Laptop System: ASUSTeK product: ASUS TUF Gaming F15 FX506LH_FX506LH
    v: 1.0 serial: <superuser required>
  Mobo: ASUSTeK model: FX506LH v: 1.0 serial: <superuser required>
    UEFI: American Megatrends v: FX506LH.310 date: 11/26/2021
Battery:
  ID-1: BAT1 charge: 29.2 Wh (79.8%) condition: 36.6/48.1 Wh (76.2%)
    volts: 12.1 min: 11.7
CPU:
  Info: 8-core model: Intel Core i7-10870H bits: 64 type: MT MCP cache:
    L2: 2 MiB
  Speed (MHz): avg: 800 min/max: 800/5000 cores: 1: 800 2: 800 3: 800 4: 800
    5: 800 6: 800 7: 800 8: 800 9: 800 10: 800 11: 800 12: 800 13: 800 14: 800
    15: 800 16: 800
Graphics:
  Device-1: Intel CometLake-H GT2 [UHD Graphics] driver: i915 v: kernel
  Device-2: NVIDIA TU117M [GeForce GTX 1650 Mobile / Max-Q] driver: nvidia
    v: 565.77
  Device-3: Sonix USB2.0 HD UVC WebCam driver: uvcvideo type: USB
  Display: wayland server: X.org v: 1.21.1.15 with: Xwayland v: 24.1.4
    compositor: kwin_wayland driver: X: loaded: nvidia
    gpu: i915,nvidia,nvidia-nvswitch resolution: 1: 1920x1080~60Hz
    2: 1920x1080~144Hz
  API: EGL v: 1.5 drivers: nvidia
    platforms: gbm,wayland,x11,surfaceless,device
  API: OpenGL v: 4.6.0 vendor: nvidia v: 565.77 renderer: NVIDIA GeForce
    GTX 1650/PCIe/SSE2
  API: Vulkan v: 1.4.303 drivers: N/A surfaces: xcb,xlib,wayland
  Info: Tools: api: clinfo, eglinfo, glxinfo, vulkaninfo
    de: kscreen-console,kscreen-doctor gpu: nvidia-settings,nvidia-smi
    wl: wayland-info x11: xdpyinfo, xprop, xrandr
Audio:
  Device-1: Intel Comet Lake PCH cAVS driver: snd_hda_intel
  Device-2: NVIDIA driver: snd_hda_intel
  API: ALSA v: k6.12.10-arch1-1 status: kernel-api
  Server-1: PipeWire v: 1.2.7 status: active
Network:
  Device-1: MEDIATEK MT7921 802.11ax PCI Express Wireless Network Adapter
    driver: mt7921e
  IF: wlan0 state: up mac: <filter>
  Device-2: Realtek RTL8111/8168/8211/8411 PCI Express Gigabit Ethernet
    driver: r8169
  IF: enp4s0 state: down mac: <filter>
Bluetooth:
  Device-1: IMC Networks Wireless_Device driver: btusb type: USB
  Report: btmgmt ID: hci0 state: up address: <filter> bt-v: 5.2
Drives:
  Local Storage: total: 476.94 GiB used: 81.16 GiB (17.0%)
  ID-1: /dev/nvme0n1 vendor: Micron model: 2210 MTFDHBA512QFD
    size: 476.94 GiB
Partition:
  ID-1: / size: 192.78 GiB used: 81.16 GiB (42.1%) fs: ext4
    dev: /dev/nvme0n1p3
  ID-2: /boot/efi size: 511 MiB used: 7.2 MiB (1.4%) fs: vfat
    dev: /dev/nvme0n1p1
Swap:
  Alert: No swap data was found.
Sensors:
  System Temperatures: cpu: 68.0 C pch: 59.0 C mobo: N/A
  Fan Speeds (rpm): N/A
Info:
  Memory: total: 16 GiB available: 15.45 GiB used: 6.51 GiB (42.1%)
  Processes: 350 Uptime: 4d 11h 57m Shell: Bash inxi: 3.3.37

I haven’t filed a bug report before so please let me know if this is memory leak and if the ‘steps to reproduce’ are informative enough. I’m also on the latest version of KDE.

Thanks :slight_smile:

2 Likes

Sorry, OP, I can’t reproduce this. I can spamclick the tray icons and it’s all fine. No gigabytes of memory usage, no scaling error, no wayland crash due to open files, no reboot.

Note that I just listed four different symptoms, so you should consider this as 4 separate problems, until you can confirm otherwise.

Pretty big gap between 4KB and 3,000,000KB mate :smiley: Also pretty big gap between 128MB (0.4% of 32GB) and 3000MB. Probably any memory usage you’re seeing is just usage, not a leak. I can make my plasmashell memory usage jump several hundred megabytes with ease and have never seen a problem with it. 3GB seems excessive, though.

Memory usage won’t trigger a reboot, the kernel will kill processes using too much memory, if it needs memory and can’t get it. It’ll cause a ‘crash’, but not a reboot. Spontaneous reboot basically implies a hardware issue. That might be driver problems or might be actual faulty hardware.

You should definitely test this with a few changes:
New user account - eliminates that you changed something and broke it
Stable graphics driver - you’re running a beta test graphics driver and seeing graphics errors. This one’s a no-brainer. Use 550.144.03 for any chance at stability.
More stable distro - Try debian or fedora or maybe neon (since you think the problem is KDE). Endeavour doesn’t exactly have a rep for running smoothly.

So for example if it were me, I’d have a fedora live USB and test with that, and if I saw evidence of a KDE issue, I might switch to neon. Good luck!

2 Likes

Thanks pallaswept, I’ll try these out and give an update :slight_smile:

2 Likes

You can try GitHub - KDE/heaptrack: A heap memory profiler for Linux that will show you an actual picture of memory used.

4 Likes

Hi - one thing that might help narrow down what’s being investigated: plasmashell crashing due to “too many open files” is almost certainly the following NVIDIA issue: Fd leak with explicit sync and kde plasma - Linux - NVIDIA Developer Forums

In general, it might be worth testing out booting using the Nouveau drivers, then checking which issues you still experience there - that could help narrow down what’s a core plasmashell issue, and what’s at least being contributed to by the NVIDIA proprietary drivers.

1 Like

I’m on EndeavourOS and having a similar problem. I have 6 Firefox tabs open and konsole and this is the output of top sorted to highest memory usage


I have a couple of widgets on my panel, too. PlasMusic Toolbar, CPU temp/Disk usage/network/RAM usage from System monitor and also Discord.

Try removing it and see if that changes something.
If it does report the issue to its dev GitHub - ccatterina/plasmusic-toolbar: KDE Plasma widget that shows currently playing song information and provide playback controls.

If not other plasmoids, one by one.

Usually that’s a plasmoid issue.

2 Likes

I’m running into same issue, I use no widgets or plasmoids, just the default systray applets that came with kde 6.3.2.

I have a 24/7 on pc (no nvidia card, igpu only) that runs some docker containers and vms and occasionally use it as media pc in the evening. This morning plasmashell was using 9GB memory causing heavy swapping and I had to reboot. This was after 2 days of just sitting, running tasks in background.

I observe the same on my laptop (has discrete nvidia), but that reboots more often so is not much of an issue.

Both use arch and kde 6.3.2 with just the default systray applets and icon only taskbar, no plasmoids, no widgets.

I observe this behaviour since about ~3 weeks ago (so almost aligned with when OP experienced it) It must have been brought up by some update as I update both machines at the same time from the same mirror.

Any help on how to troubleshoot further? What debug info can I gather next time I see the high memory usage?

This tool will find out what is causing this memory leak.

Once you get it working and active during such a memory leak event, report a bug with screenshots of the flamegraph, relevant indicators in different tabs.
You need debugsymbols with debuginfod so that it can work properyly.

We’d need to know your distro and whether you use X11 or Wayland to understand better.

This isn’t something common, I don’t have it on my laptop with a 9 days uptime (about time I reboot, got some updates), so something particular on your system triggers it. Just need to find out what.

Hi, the distro is Arch, flavour Garuda Linux. Session is Wayland. I installed gdb, debuginfod and heaptrack.

I wrote 0 to /proc/sys/kernel/yama/ptrace_scope and ran heaptrack --pid {pid of plasmashell}.

It outputted

╭─sammael@viglen in ~ as 🧙 took 0s
╰─λ sudo heaptrack --pid 5596

heaptrack output will be written to "/home/sammael/heaptrack.plasmashell.55559.zst"
injecting heaptrack into application via GDB, this might take some time...
injection finished

and is I presume running now, gathering data in the bacground?

So I just let it run until the memory usage of plasmashell grows and then I do what?

Sorry, but this is all quite “above my paygrade” so to say.

You kill plasmashell. For instance pkill plasmashell.

Then with heaptrack_gui you load the created file /home/sammael/heaptrack.plasmashell.55559.zst it might be quit big and slow to open and that’s expected.
Heaptrack should launch the gui when plasmashell quits.

What would be considered “high” memory usage or a good stop point?

It’s sitting at ~600 MB atm which is normal-ish? I’ll let it run until evening and see how much / if the ram grew and report back.

Thanks for your help!

~600 MB is normal business.
This includes cached disk data.
Anything above ~800MB should be abnormally high.

Running continuously with heaptrack will make a huge output file which might cause failure, be warned.

Do you have themes installed ? For plasma or sddm ?

It’s 720M atm, and the .zst file is only 18M so far.

I use Sweet / Sweet-Dark theme everywhere it’s available. I also use kde-effect-rounded-corners-git and kwin-effects-forceblur with original Blur effect disabled if that matters?

So say if plasmashell gets to 1GB is that enough info gathered to stop the heaptrack thingy?

I stopped it when usage was 1.2GB. On laptop in same time it was around 1GB, but I was not running heaptrack there.

I’ve no idea what I’m looking at in the .zst file :sob:

here’s the .zst file on my nextcloud: ht tps://o.o5.ddns.net/plasma (I can’t post links had to put space in https)

1 Like

Great effort !

I was able to use the zst file you uploaded, and get the most relevant parts:

We can see a memory leak in Qt:

I am not on arch though, so some symbols are missing.

Something I can’t see in the Caller/callee tab is the function name here:

This is most likely because I am not using the same distro, but if you could make a screenshot for this tab that would be helpful.

Hi,
it’s showing as undefined on mine too, do I need to install anything else and run it again to give it name?

I just woke up and the plasmashell is at 1.4G already again.

You might be missing some debug symbols :confused:

What if you run once coredumpctl -1 gdb plasmashell.
If you had a previous crash in plasmashell it will download the necessary symbols. It should offer to download and install debug symbols, accept all of them.
Once you get to the line (gdb) link, type in “exit” then enter, or Ctrl+D to quit.

Otherwise it should mean, your debug symbols for plasmashell or other packages is not up-to-date anymore, and you might need to do a new heaptrack capture.
Or there is another issue, but I couldn’t say what. Maybe your distro has custom plasma packages without debug info matching your binaries available, hard to say.

I’ve got coredumps disabled to save on space, but not on laptop and there’s no files for plasmashell. The plasmashell just grows and grows and grows, but doesn’t crash. I got plenty of memory in both machines so the worst I seen so far was 9G and heavy swapping. The only coredumps on laptop are from fossilize_replay which is steam shader preprocessor.

How would I install these debug symbols?

edit: ok I’ll try to post on my distro forum and point here, see if they know something.